2522
Proceedings of the 18
th
International Conference on Soil Mechanics and Geotechnical Engineering, Paris 2013
2 LABORATORY TEST RESULTS
2.1 Parameters of deep-mixing technologies
The quality of the mixed depends on the applied binder type and
quantity as well as the ratio of water to binder in the mixture.
These quantites can be expressed by volume or weight. It is
essential that the water content of the original soil is considered
when calculating the water content of the slurry.
The binder quantity is described with the cement factor (
and the in-place cement factor (
inpl
):
−
=
m
cement
/
V
soil
= binder weight / soil volume [kg/m
3
],
−
inpl
=
m
cement
/
V
mix
= binder weight
/ mixture volume [kg/m
3
].
The water content of the soil is described with
−
w
T
/
c
=
m
w,mix
/
m
cement
= the total water-cement ratio [-].
The quality of the mixture is generally described with two
parameters:
−
q
u
= the unconfined compressive strength [MPa],
−
E
= the Young’s modulus [MPa]).
These mechanical properties are generally measured at 7, 14,
28, 42 and 90 days after mixing, because the stregthening of the
improved soft fine grained soils is a long process, but the qua-
lifying parameter is generally the 28 day unconfined com-
pression strength [Filz et. al., 2003].
2.2 Properties of the chalky silt soil before treatment
Based on the laboratory tests, the main parameters of the
original chalky silt are listed in Table 1.
The soil changes its color if its water content changes: the
in-situ moist soil is pale yellow, while it turns light grey when
drying. It has high lime content; the texture has small roots and
organic threads, and high sensitivity. Based on laboratory tests,
it is classified as highly plastic silt (MH).
Table 1. Soil properties of the chalky silt soil in „Sárrét”
2.3 Data of chalky silt mixtures
In the testing program the use of both deep-mixing
technologies was investigated. Thirteen different mixtures were
prepared by varying
and
w
T
/
c
parameters (Table 2).
Mixtures P1-P3 were made with low water contents and with
slightly-varying cement contents. Mixtures 1-5 were prepared
with lower water contents but highly varying cement contents.
The mixtures 6-10 were made
with a little bit greater water
contents and with cement contents varied in the similar range.
Since the water content of the original soil was high the
addition of water was less significant in comparison to cement.
The cement content dominated the behavior of the mixture.
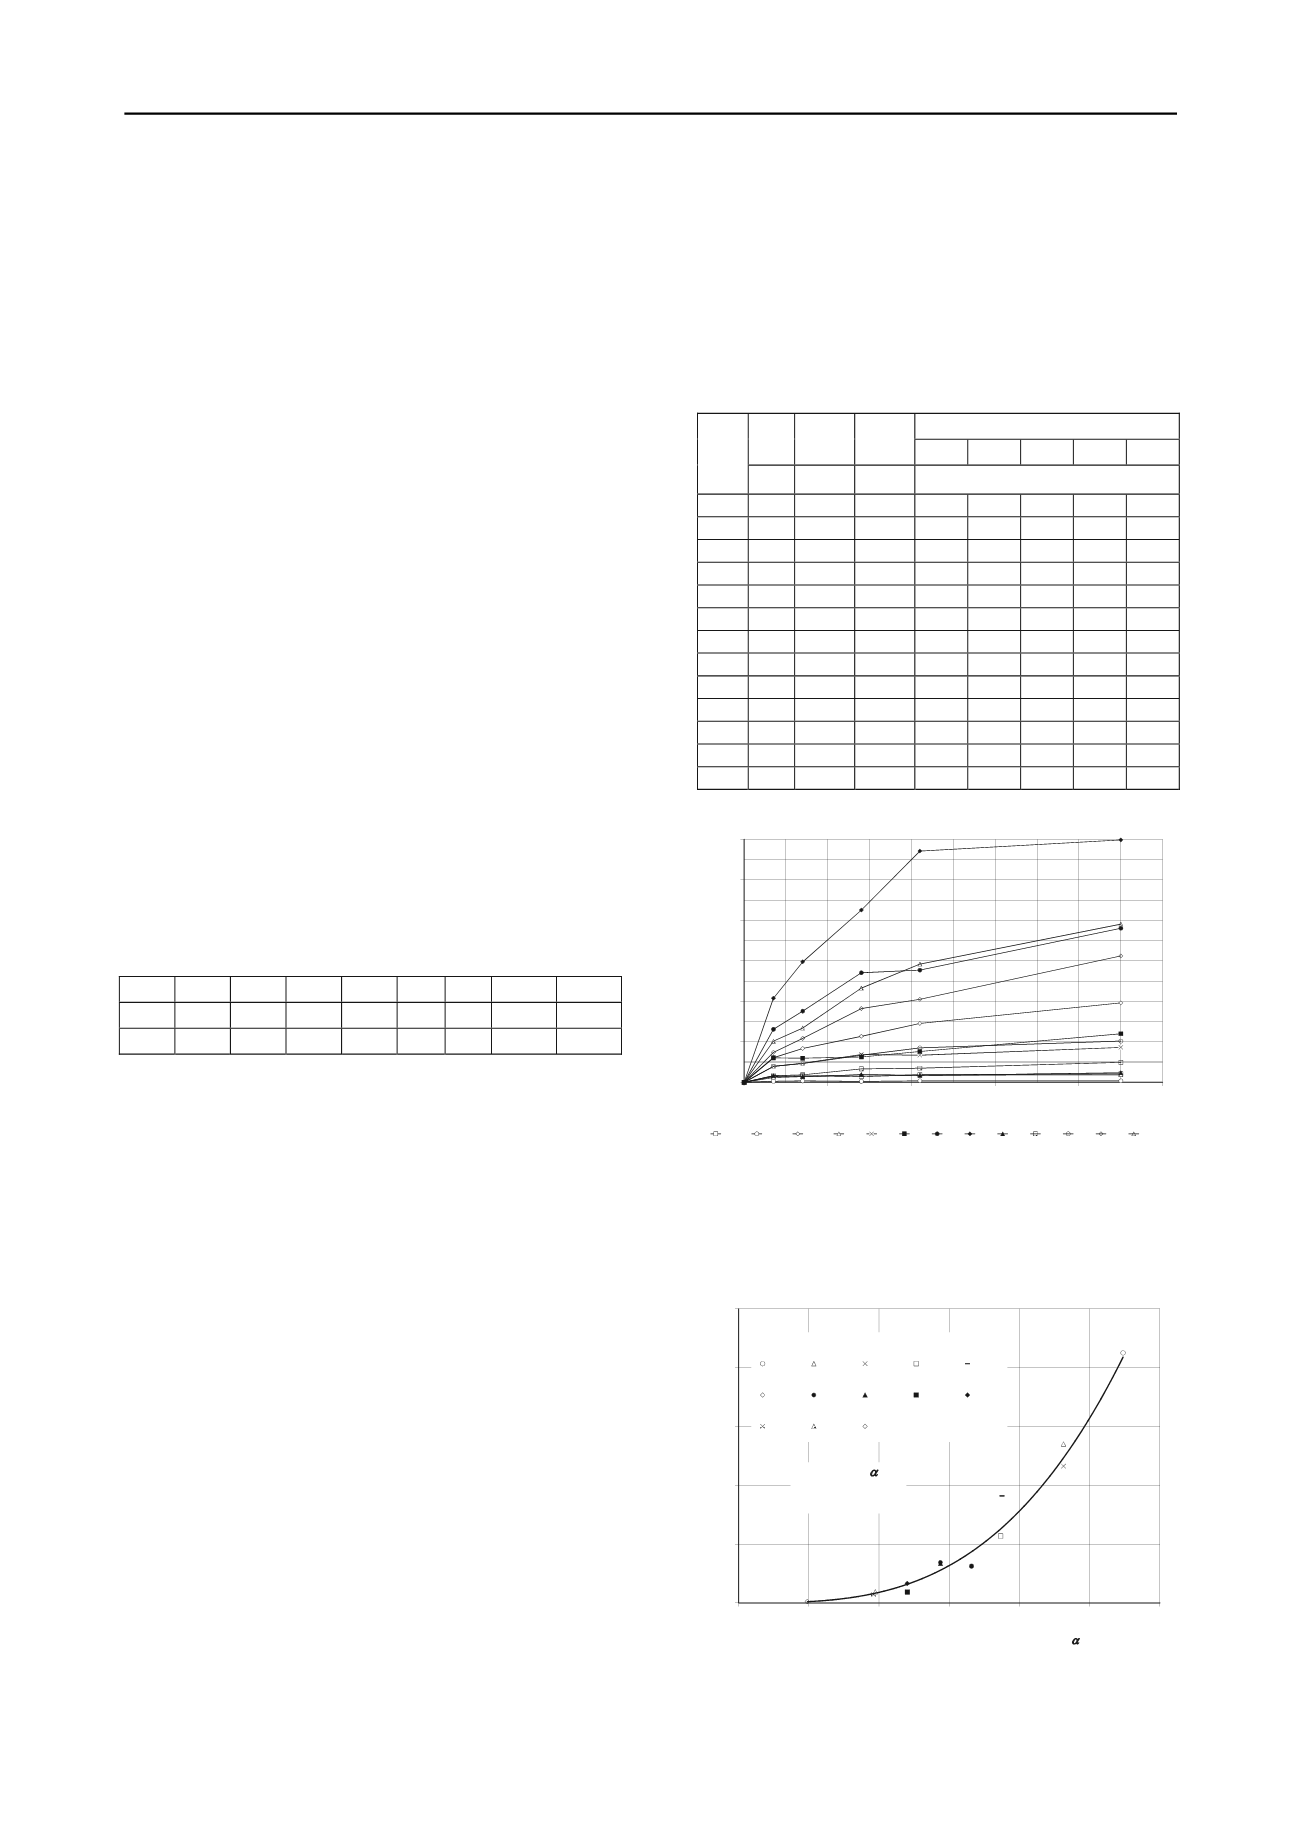
2.4 Evaluation of stabilized soil parameters
In Figure 3, the increase of unconfined compressive strength
with time is shown. As expected, the strength increases with
time, but the hardening/strengthening rate is different from that
of the concrete. The strength is less than 2.0 MPa for cement
content of 50-300 kg/m
3
. Generally, 0.5-2.0 MPa 28-day
unconfined compressive strength is required for column-type
deep-mixing, and somewhat lower strength for mass
stabilization (Moseley and Kirsch, 2004). The data presented in
figure three indicate that:
− 4 tested mixtures (P2, 1, 6 and 7) which have a cement con-
tent of 125 kg/m
3
or less did not reach 200 kPa unconfined
compressive strength, but 3 of them would be acceptable for
a mass stabilization, only P2 with a cement content of 50
kg/m
3
should be considered as too weak,
− the 28-day unconfined compressive strength of mixtures 2, 3
and 8 (cement content = 150-175 kg/m
3
) was about 330 kPa,
and for 90 days it increased to 500 kPa (50 %). These
mixtures could be accepted for mass stabilization,
− the 28-day unconfined compressive strength of the rest of the
samples with cement contents of 200-300 kg/m
3
were 500-
2000 kPa with a 90-day to 1000-3000 kPa (50-100 %).
These would be acceptable for column-type deep-mixing.
Table 2. Parameters of the mixtures
0
500
1000
1500
2000
2500
3000
0
20
40
60
80
unconfined compressive strength
q
u
[kPa]
hardening time
t
[days]
100
P1 P2 P3 1 2 3 4 5 6 7 8 9 10
Figure 3. Measured hardening/strengthening of chalky silt mixtures
Figure 4 shows the relationship between the 28-day
unconfined compressive strength (
q
u
) and in-place cement
factor (
inpl
). The exponential trendline fits the points well with
R
2
=0.97. The chalky silt responded well to cement addition.
q
u
= 4.8
·
10
-5
·
inpl
3.1
R
²
= 0.97
0
500
1000
1500
2000
2500
0
50
100
150
200
250
300
28 days unconfined compressive strength
q
u
[kPa]
cement factor in-place
inpl
[kg/m
3
]
2,22 2,67 2,74 3,37 3,43
3,81 4,43 4,54 5,33 5,48
6,75 6,81 13,47
w
T
/
c
total water-cement ratio
Figure 4. Measured relationship between
q
u
–
inpl
Figure 5 shows how the 28-day unconfined strength depends
on total water-cement ratio. Samples with high water content
w
L
w
P
I
P
w
e
E
s
E
s,ur
c
*
%
%
%
%
-
MPa MPa
-
-
72.1 54.4 17.7 71.1 2.08 2.1 15 0.0015 0.038
q
u
kPa
w
T
/ c
inpl
7
14
28
42
90
mix-
ture
-
kg/m
3
kg/m
3
day
P1
6.8
102
96
70
80
70
93
104
P2 13.5 51
49
12
17
11
18
17
P3
3.4
204
187
303
418
567
727
980
1
5.3
127
120
58
69
92
88
93
2
4.4
153
144
196
235
343
334
430
3
3.8
178
166
301
297
312
380
598
4
2.7
254
231
655
878 1351 1384 1900
5
2.2
305
274 1037 1487 2125 2853 2991
6
6.8
108
97
81
71
94
82
117
7
5.5
134
120
81
92
165
174
246
8
4.5
162
144
196
231
334
424
508
9
3.4
214
188
370
542
910 1024 1559
10
2.7
268
231
508
670 1162 1458 1952


