2519
Technical Committee 211 /
Comité technique 211
predominant frequency of the system (herein: the soil column
overlying gneissic bedrock), and ζ: damping ratio of the system.
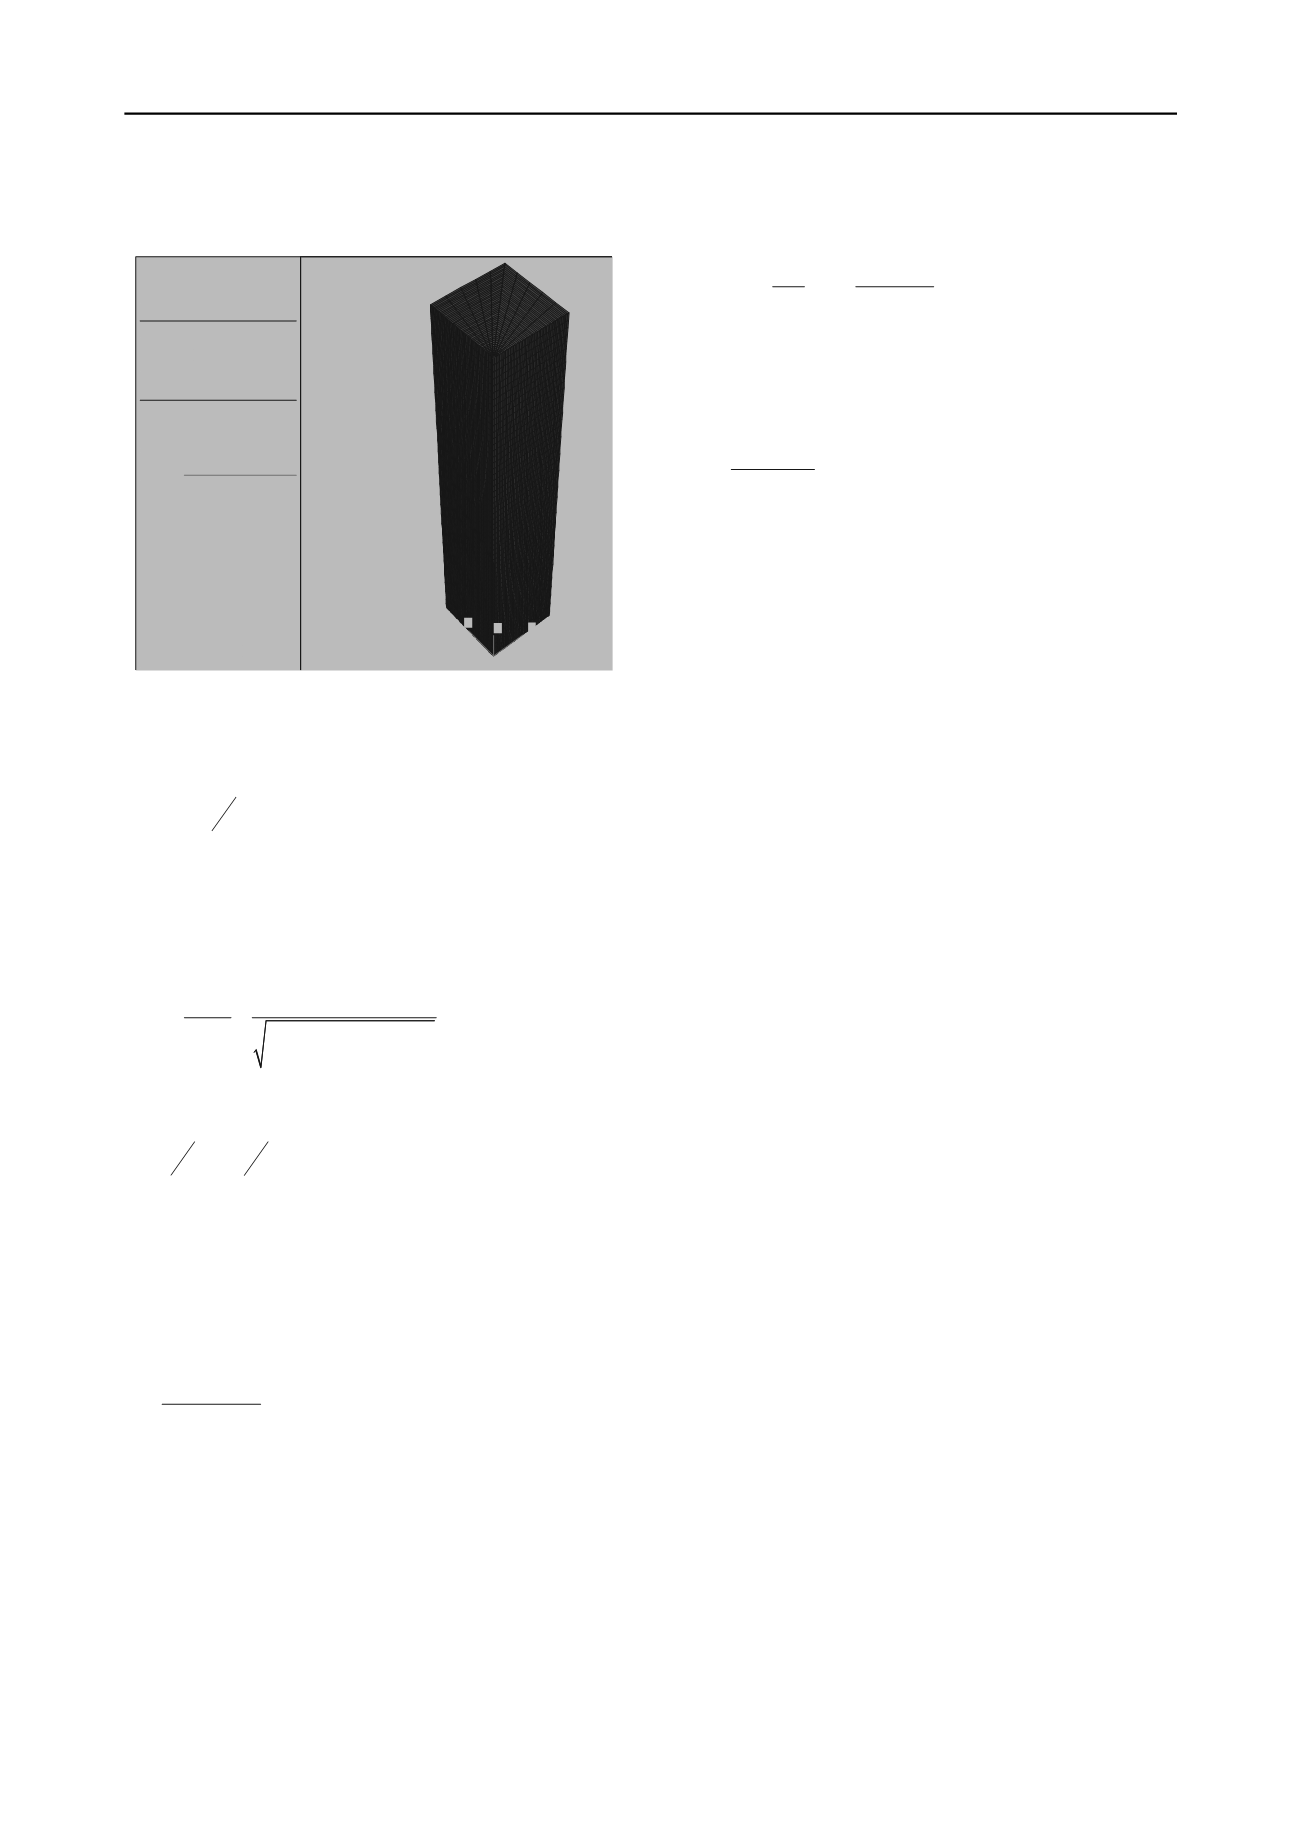
FLAC3D 3.10
ItascaConsultingGroup, Inc.
Minneapolis,MN USA
©2006 ItascaConsultingGroup, Inc.
Settings: ModelPerspective
13:40:35SatSep272008
Center:
X:6.836e+000
Y:9.322e+000
Z:5.757e+000
Rotation:
X:140.000
Y:130.000
Z:360.000
Dist:7.957e+001 Mag.: 1.25
Ang.: 22.500
Surface
Magfac= 0.000e+000
Live&unassignedmechzones shown
Axes
Linestyle
X Y Z
Figure 1. Model grid used for 3D numerical analyses.
From equation (1), it results that ratio u(f)/u
st
is greater than
1.0 when f/f
1
<1.0, and vice versa, when f/f
1
>>1.0. In this last
case, it results:
12 /
1
/) (
1
f f
u fu
st
(2)
Based on the aforementioned, in order to use an “equivalent
static” loading instead of a dynamic or harmonic one, we need
to use a coefficient b(f), defined as in equation 2. As b(f) is
proportional to u(f)/u
st
, it is evident that it will be inversely
proportional to loadings, i.e. the ratio P
st
/P(f). Therefore:
2 2
2
1
1
1 /
4
st
P f
b f
P
f f
(3)
In the present problem, it can be assumed approximatively, that:
H
V
H
V f
S
La
8
3
4
1
(4)
where, V
La
: wave velocity according to Lysmer (V
La
≈1.5V
S
),
V
S
: shear wave velocity, and H: depth of the soil column
overlying the gneissic bedrock.
Consequently, for the examined case , where a mean depth of
the soil column is admitted as: H=30m and V
S30
≈250m/sec, the
predominant frequency of the system for vertically induced
harmonic external loading, can be roughly approximated, as:
1
3 250 /
3
8 30
m s
f
Hz
m
(5)
For input motion frequencies ranging from 20 to 35Hz (mean
estimated value of 30Hz) and mean estimated value of damping
ratio ζ=20% (Mylonakis et al 2006), equation (3) results b≈0.15,
which represents a reductional coefficient due to the frequency
of the input motion. It is estimated that due to a large number of
uncertainties of the system, and also because the examined
system is not a single degree freedom oscillator, it would be
wiser to impose a factor of safety of 2.0, resulting thus to a
design coefficient b
design
=b x 2 = 0.3. Accordingly, it results that
P
st
≈30%P
cyclic
.
Based on the above, vertical harmonic loading imposed by a
hydraulic vibrating torpedo, can be calculated via cyclic normal
stress (30 to 35MPa) applied through the edge of the vibrating
column of a diameter d=0.40m. The vertical harmonic loading,
is calculated, as follows:
MN
x x
d q P
cyclic
cyclic
768 .3
4
4.0 14.3 30
4
2
2
(6)
providing thus an equivalent static vertical loading
P
st
≈30%P
cyclic
=0.3 x 3.768≈1.13MN, and an equivalent vertical
normal stress that is estimated to compact vertically the crushed
fill material of the stone column at every step of construction:
kPa
x
x
st z
1777
8.0 14.3
4 1130
2
,
(7)
According to linear elastic theory, earth pressure coefficient at
rest, equals to: k
0
= ν/(1-ν) = 0.3/(1.0-0.3)≈0.429, and then the
equivalent radial (horizontal) static normal stress is estimated
σ
’
h
= 0.429 x 1777≈762kPa.
For the numerical analyses performed, for the deeper part of the
stone column it was adopted a radial pressure of 750 to 800kPa,
whereas, it has been progressively reduced as ascending steps of
stone column construction were getting close to the head of the
stone column at free surface until it has almost been nullified in
the last step.
5. NUMERICAL ANALYSIS IMPLEMENTATION &
RESULTS
Developing a step by step simulation of a stone column
construction (excavation, filling & compaction), analysis results
are mainly concentrated to the plasticity limits of soil strength
and to the outwards lateral displacement of the stone column
excavated sides due to gravel compaction. Plasticity indicators
for shear or tension are divided at a present plastic yield
indicator with symbol (–n) or a past plastic yield indicator with
symbol (–p). Outwards lateral displacement are being recorded
at every depth level of the stone column, in different grid points
with distance of 0, 30cm, 60cm and 100cm of the excavated
sides of the stone column.
Figure (2) shows plasticity indicators generated due to the
excavation at full penetration depth. It can be seen that one step
column excavation, has no remarkable effect at inwards
horizontal displacements. At this case, plasticity limits of soil
strength developed in a distance of 0.20-0.40m surrounded
excavated sides. Inwards horizontal displacements of the
excavation are limited in a range of 4-5mm with maximum
values appearing at deeper levels of excavation.
Sub-stages IIIa & IIIb simulate the compaction/filling of
crushed stone material and interaction of the above to
surrounding soil. Figures (3) and (4) exhibit plasticity indicators
for two different construction depths from 16m to 15m and from
1m up to the head of the stone column (free soil surface)
respectively. Although, most of plastic indicators, reveal a past
plastic yield (indicator –p) in shear or tension, plasticity
disturbance of the soil is generated in a remarkable distance of
1.0 to 1.2m surrounding column sides for the first example and
in almost the entire surface area of the surrounding soil at the
second one. Low initial stress state at free soil surface, leads to a
remarkable plastic yield over limit close to the stone column
head, even though equivalent static normal radial stress is very
low. Concerning lateral outwards displacement of stone column
excavated sides, due to gravel compaction/filling, shows that
values between 10 and 20cm keep well at a distance of 100cm
of the excavated sides. Indicatively, outwards radial
displacement values (at excavated sides) for depths at 22.5m,
11.0m and 1.0m are in a size of 23cm, 12cm and 20cm
respectively. In general terms, outwards horizontal
displacements are eliminated at distances more than 60cm of
excavated sides.


