2523
Technical Committee 211 /
Comité technique 211
show very low strength, and improvement of soil with
w
T
/
c
> 8
is not possible. When
w
T
/
c
< 4 the strength increased rapidly
with decreasing water-cement ratio, but this also means the soil
is very sensitive to changes in its properties. Since the total
water-cement ratio hardly changes, it is clear that the role of
cement factor is significant.
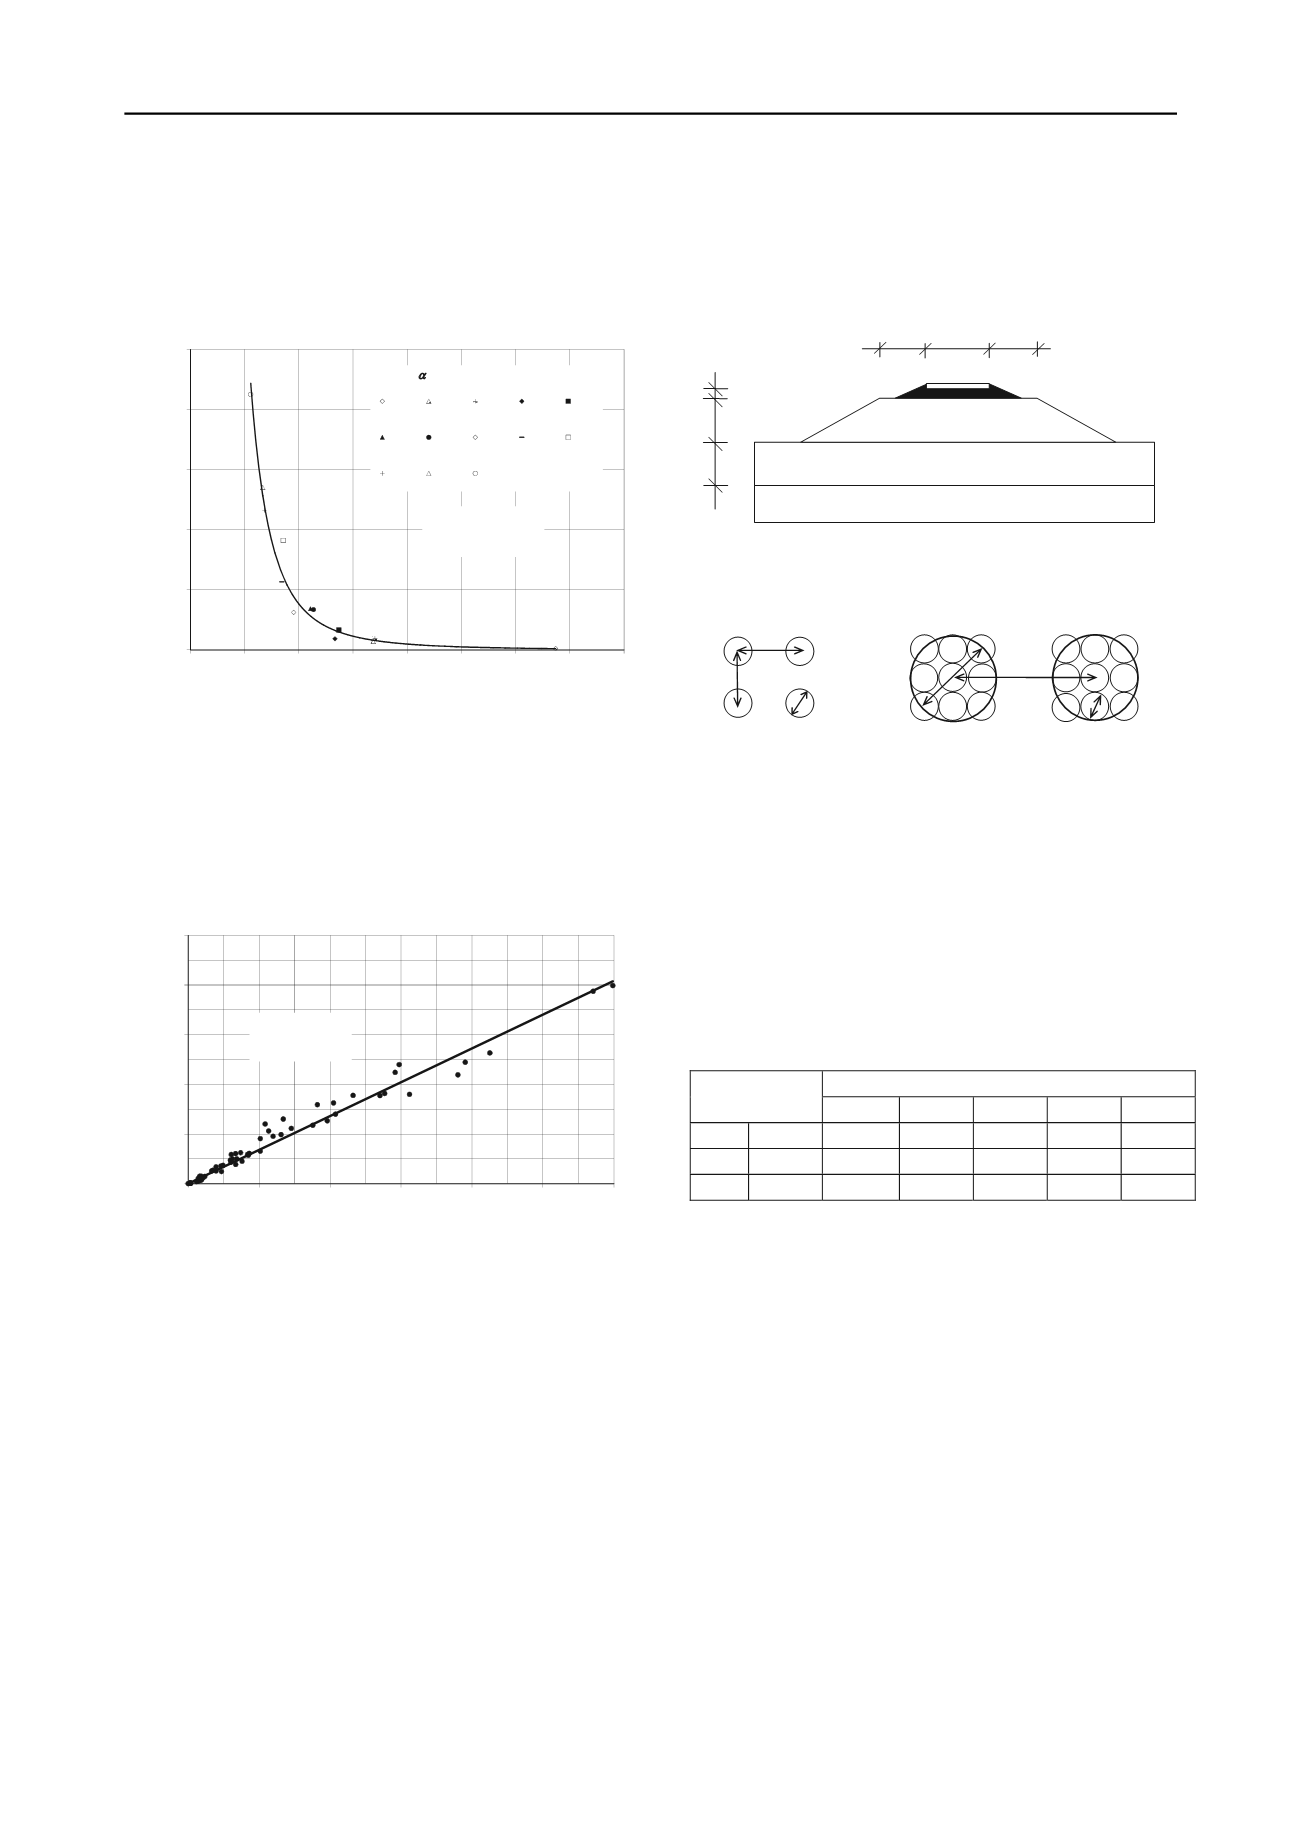
q
u
= 24000/(
w
T
/
c
)
3.0
R
²
= 0.97
0
500
1000
1500
2000
2500
0
2
4
6
8
10
12
14
16
28 days unconfined compressive strength
q
u
[kPa]
total water-cement ratio
w
T
/
c
[-]
49 96 97 120 120
144 144 166 187 188
231 231 274
inpl
cement factor in-place
Figure 5. Measured relationship between
q
u
–
w
T
/
c
Figure 6 shows the relationship between the unconfined
strength and the Young’s modulus. It can be seen that the trend-
line fits very well. In this respect, the chalky silt of „Sárrét”
behaves as expected: the modulus is proportional to unconfined
strength. The equation from the figure can be simplified to
E
u
= 70·
q
u
(1)
where the units are both in kPa.
E
u
= 0.068 ·
q
u
R
2
= 0,97
0
50
100
150
200
250
0
500
1000
1500
2000
2500
3000
Young modulus
E
u
[MPa]
unconfined compressive strength
q
u
[kPa]
Figure 6. Measured relationship between
q
u
–
E
3 MODELING OF DEEP-MIXING TECHNOLOGIES
3.1 Site evaluation
The second part of our research program was to apply a
calculation method and give some guidelines for design. Both
technologies (column-type and mass stabilization) were studied
for expected design conditions at the Sárrét site. Variation in
soil layering, soil strength and compression parameters, and
embankment height will dictate the choice of technology. The
PLAXIS 3D program was used to assess the effect of
stabilization on stability and settlement.
The geometry of the embankment and the parameters of the
untreated soil are shown in figure 7. Groundwater level was
assumed to be even with the ground surface. Sandy-gravel,
suitable for structural fill, was used for embankment material. A
3-m wide, 52.5 kPa distributed load was placed on top of the
ballast during the stability analysis.
Column diameters were 60 cm, with a 5.0-m uniform length
extending into the gravel layer. The columns were placed in
2.0×2.0-m and 3.0×3.0-m square grids (Figure 8). In order to
model partial mass stabilization, 1.8-m diameter equivalent
columns were placed in 2.4×2.4-m, 3.6×3.6-m and 5.4×5.4-m
square grids (Figure 9.). Total mass stabilization has been
analyzed by modeling the treated soil as a homogeneous
composite of mixed and in-situ soils with averaged strength
properties.
railtrack
embankment
= 20 kN/m
3
1:1.5
E
= 50 MN/m
2
= 40°
= 10°
gravel
E
= 25 kN/m
2
= 36°
= 6°
= 22 kN/m
3
soft soil
E
s
= 2000 kN/m
2
c
ref
= 10 kN/m
2
unsat
=15 kN/m
3
3.0
3.0
3.0
0.6
3.4
5.0
Figure 7. The model geometry and soil properties
The unconfined compressive strength of the 5 mixtures was
used for modeling as base parameters (Table 2). Strength
assigned to the column material in the analysis was assumed to
be half of the unconfined compressive strength measured in the
laboratory. In PLAXIS, this strength is represented by the
cohesion (c
ref
). Based on laboratory tests, Young’s modulus for
the columns was 70 times the unconfined compressive strength.
The value of Poisson’s ratio was
= 0.2 .
Table 2. Mechanical parameters of the mixtures
The analysis modeled the construction and load stages in
five steps:
− placement of deep-mixing soil material,
− construction of initial 2-m high embankment in 30 days,
− construction of final embankment height in 30 days,
− final state (consolidation up to 5 kPa pore pressure).
− stability analysis considering traffic load.
3.2 Analysis of settlement reduction
The results were evaluated by plotting the calculated settlements
versus the unconfined strength of improved soil elements
(Figure 10.). The following conclusions can be drawn:
− with increasing strength all technologies reduce settlement,
but the effectiveness depends significantly on column
diameter and spacing,
− there is a relation between column spacing and
q
u
. If
q
u
is too
small, the column spacing is no longer effective, no matter
how close. At a higher
q
u,
the column spacing scheme is
efficient,
− for partial and total mass stabilization settlements reduce
rapidly as
q
u,
increases, up to 0.4 MPa. Beyond this value,
the improvement is much less significant,
column diameter
d
= 0.6 m
column distance
L
= 2.0 and 3.0 m
distance of equivalent columns
L
= 2.4; 3.6 and 5.4 m
diameter of single
column
d
= 0.6 m
diameter of equivalent
column
d
= 1.8 m
Figure 8.
Column-type deep-mixing
Figure 9.
Partial mass stabilization
mixture
Mohr-
Coulomb
1.
2.
3.
4.
5.
E
ref
kN/m
2
7000
1500
20000
40000
70000
q
u
kN/m
2
100
200
300
600
1000
c
ref
kN/m
2
50
100
150
300
500


