2534
Proceedings of the 18
th
International Conference on Soil Mechanics and Geotechnical Engineering, Paris 2013
cement stabilised soils (rydén
et al.
, 2006).new samples were
prepared to measure the early strength development, see
figure 1.after more than 1200 hours the samples were removed
from the plastic mould that supported the samples during
compaction and in the beginning of the curingperiod of the
samples. this resulted in a small drop in p-wave velocity.
Curing time (h)
0
200
400
600
800
1000
1200
1400
P-wave velocity (m/s)
200
400
600
800
1000
1200
1400
1600
1800
2000
2200
PS 1
PS 1
PS 1
PS 1
PS 1PS 1
PS 1
PS 2
PS 2
PS 2
PS 2PS 2
PS 2
PS 5
PS 5
PS 5
PS 5
PS 5
PS 5
PS 5
PS 5
PS 5
PS 5
PS 6
PS 6
PS 6
PS 6
PS 6
PS 6
PS 6
PS 6
PS 6
PS 6
PS 9
PS 9
PS 9
PS 9
PS 9
PS 9
PS 9
PS 9
PS 9
PS 9 PS 9
PS 9 PS 9PS 9PS 9 PS 9PS 9PS 9
PS 11
PS 11
PS 11
PS 11
PS 11
PS 11
PS 11
PS 11
PS 11
PS 11 PS 11PS 11 PS 11PS 11PS 11 PS 11PS 11PS 11
Curing time (h)
0
200
400
600
800
1000
1200
1400
P-wave velocity (m/s)
600
800
1000
1200
1400
1600
1800
Sample 1
Sample 2
Limit
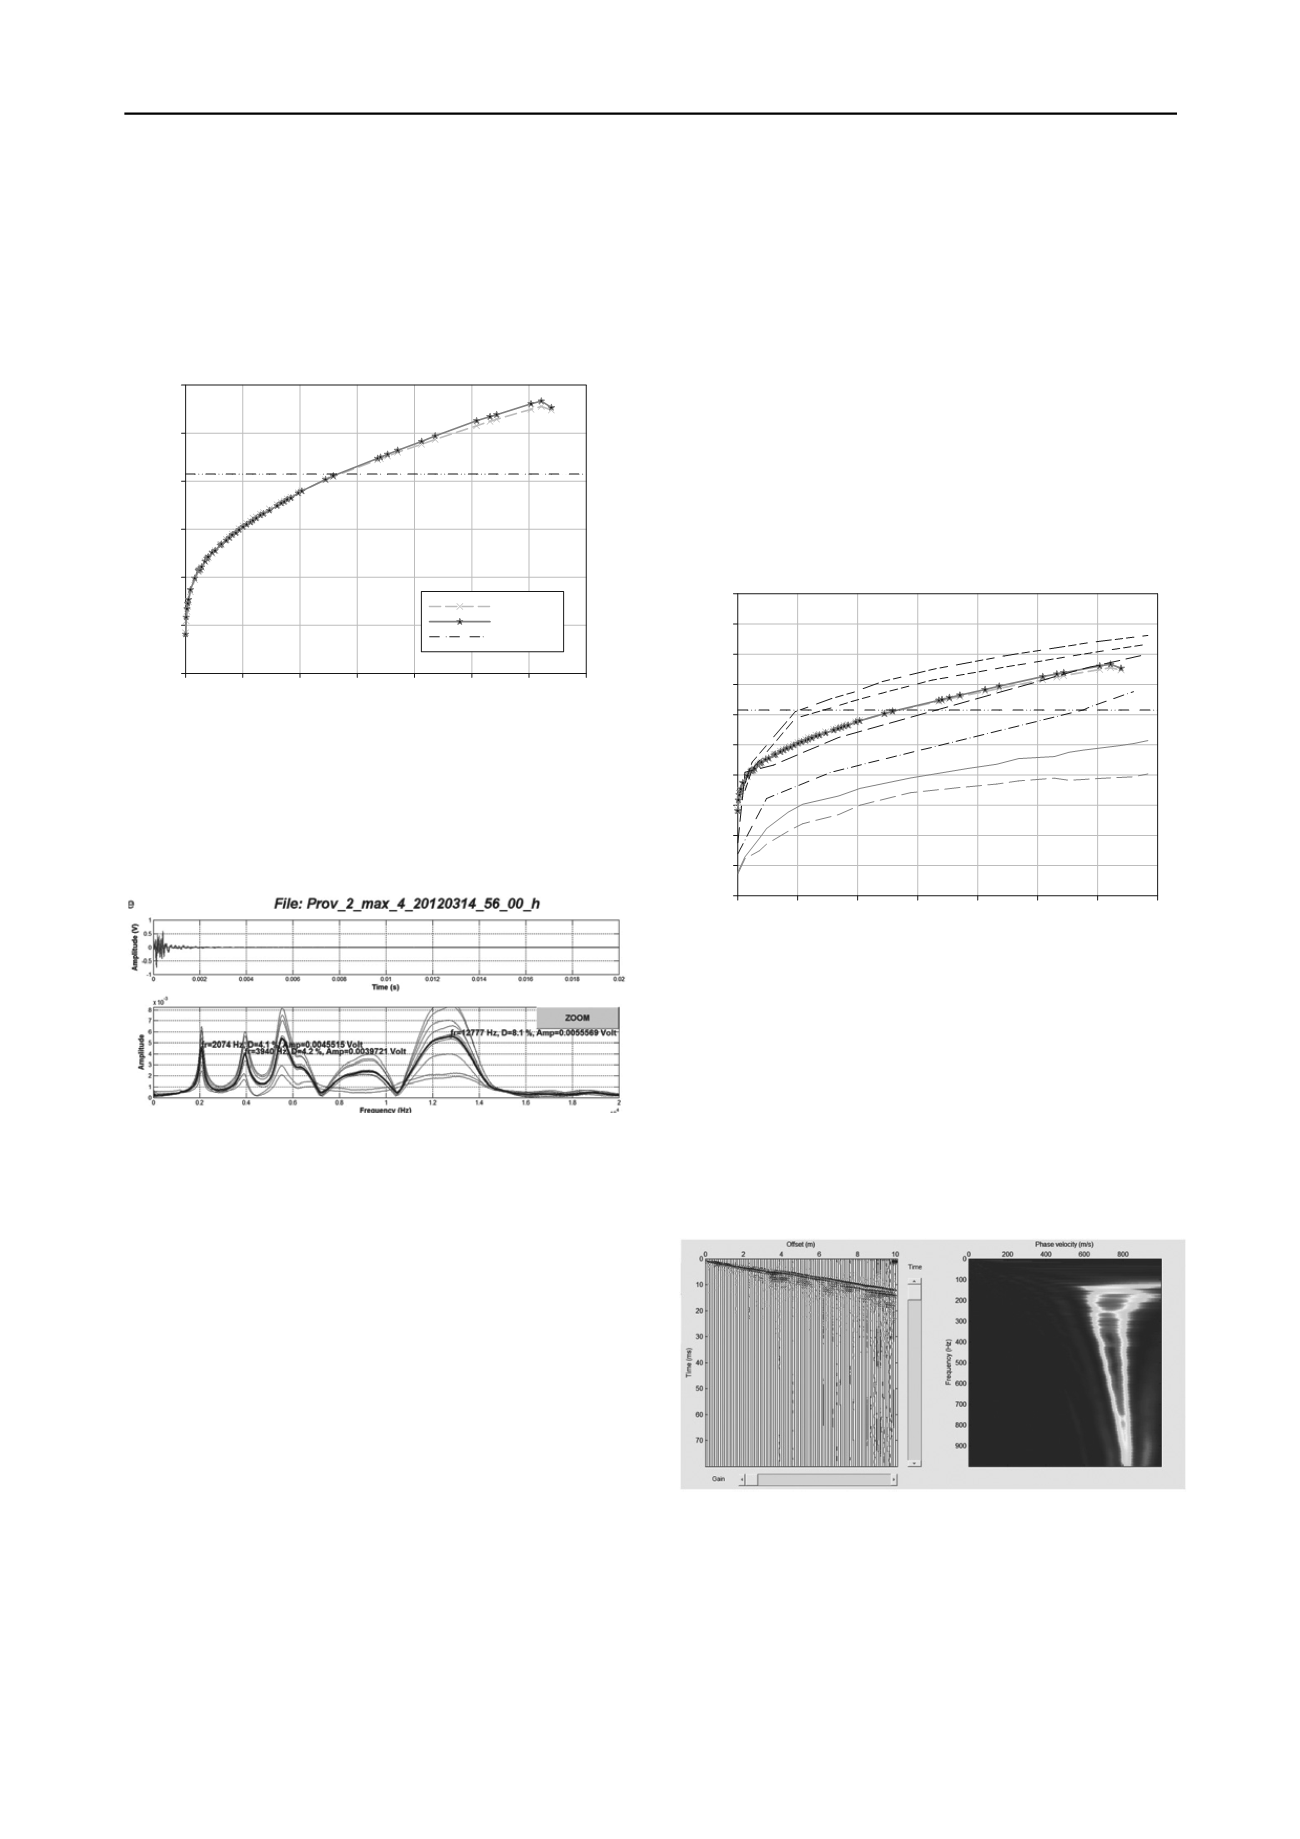
figure 1.the figure shows the development of compressive wave
velocity with time. the drop in velocity after 1240 hours is caused by
removing the samples from the plastic mould.
the seismic measurements of the prepared samples were
performed several times every 24 hours for the first 400 hours.
in figure 2 the measured frequency is shown together with
higher frequency modes.
figure 2.different frequency modes for sample number 2 after 56
hourscuring. the lowest frequency peak corresponds to a fundamental
mode longitudinal resonance frequency of 2074 hz which corresponds
to a p-wave velocity of 1043 m/s.
the longitudinal resonance frequency of 2074
hzcorresponds to a p-wave velocity of 1043 m/s for sample 2.
the samples needed approximately 500 hours of curing in 20
degree celsius to meet the requirements regarding p-wave
velocity.
2 in-sitU measUrements
the quality testing in-situ was done both as ordinary testing
with binder content, mcV, pulverization and e
vib
measurement
with the compaction roller. the testing procedure also included
sampling from the stabilised soil when the mixer had made two
mixing passes. the stabilised soil that would be tested was
excavated and transported to a field laboratory for compaction
in plastic moulds. after compaction the p-wave velocity was
measured and compared with the laboratory mixed samples.
most of the production samples (ps) were stored in room
temperature to ensure the same conditions compared with the
laboratory compacted samples.
there was a great variation in the development of p-wave
velocity versus curing time for different samples, see figure 3.
the causes of this variation were a combination of different
Variation in grading (clay content)
in the figure. the sample ps 9 was
figure 3.development of compressive wave velocity with time for
ref
transfer is one
dim
e will affect the stabilised soil in-situ.
n example of the in situ seismic measurements is shown in
st
a
me
e
value of the stabilised soils’ performance. the seismic testing
will be followed up in future with testing on the concrete slab.
parameters such as;
Variation in water content
Variation in density
Variation in the degree of pulverization
in order to study the development of p-wave at different
temperatures two pairs of specimens were manufactured. one
pair was stored in room temperature and the other pair was
stored at outside temperature. the difference in p-wave
development is shown in figure 3. the different samples are
denoted ps9 and ps11
stored at room temperature and the sample ps 11 was stored at
outside air temperature.
erence and production samples.
the production sample denoted ps9 required more than
2400 hours achieving the limit value of 1430 m/s and the
sample ps 11 did not achieve the required limit. however,
storing a specimen in an outside air temperature is not fully
correct compared to the in situ conditions due to larger volume
of stabilised soil and in the in-situ case the heat
ensional. it does however give an idea of how low
temperatur
a
figure 4.
figure 4.a result from seismic in-situ measurement along the surface of
the stabilised layer is presented in the figure. the top layer has almo
re ched a surface wave velocity (~0.92Vs) of 800 m/s at the time for
asurement. the target shear wave velocity after curing is 900 m/s.
the in-situ measurement of the stabilised soil is performed
with the same equipment as used for sample testing. however,
the in-situ testing involves the whole volume and gives a tru


