2542
Proceedings of the 18
th
International Conference on Soil Mechanics and Geotechnical Engineering, Paris 2013
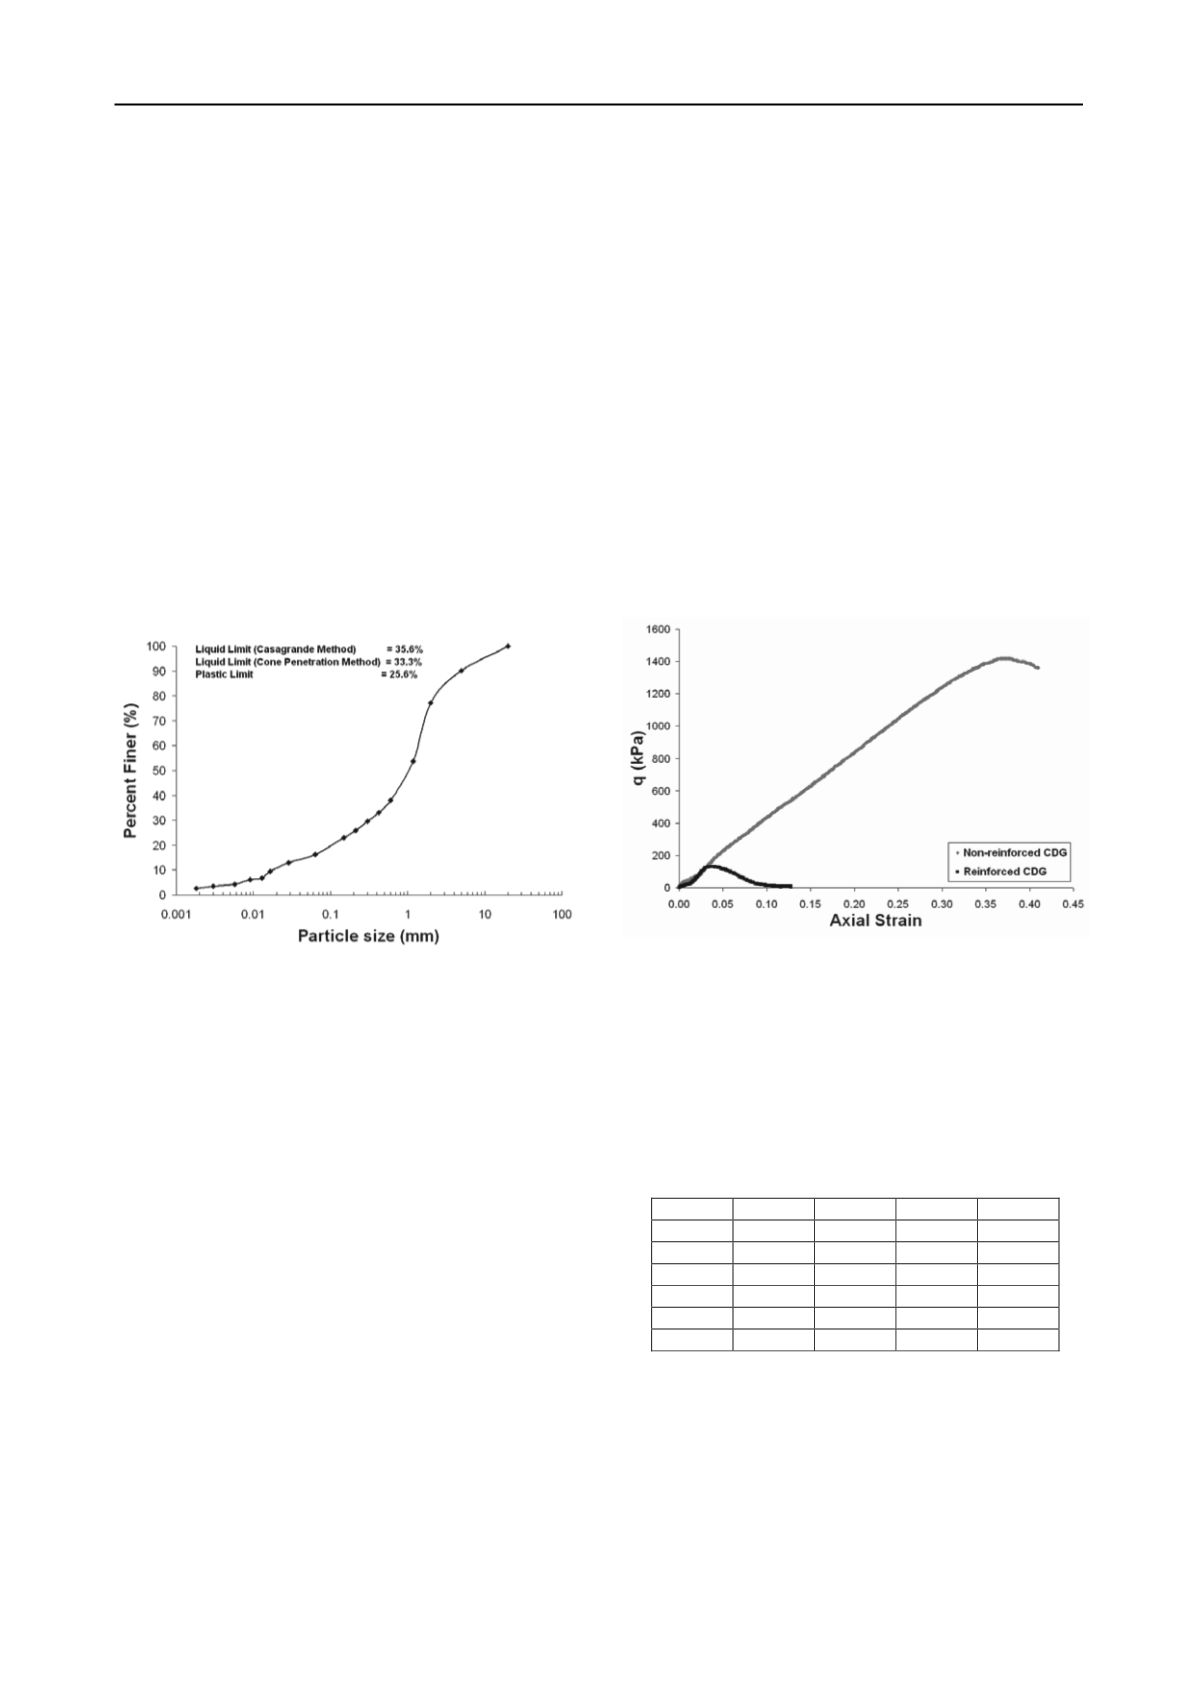
kaolinite and feldspar (Yan and Li, 2012). The grain size
distribution (shown in figure 1) reflects that the soil has 16%
particles finer than 63
. The specific gravity of the soil was
found to be 2.65. From Standard Proctor compaction tests, the
maximum dry density of the soil was determined as 1.93Mg/m
3
with an optimum moisture content of 12.3%. Tests on particles
finer than 425μ indicated the plastic and liquid limits to be
25.6% and 35.6% respectively. Using the Unified Soil
Classification System (USCS) the soil can be classified as
clayey sand of low plasticity (SC-CL).
The fibres used are short filaments made of polypropylene
similar to those used by Silva dos Santos
et al
. (2010). They are
chemically inert and have uniform characteristics, with a
relative density of 0.91, a tensile resistance of 120MPa, an
elastic modulus of 3GPa and a range of linear deformation at
rupture between 80% and 170%. The dimensions of the fibres
used in the tests were 0.023mm in diameter and 24mm long
(Silva dos Santos et al., 2010). After performing a series of
unconfined compression tests on CDG reinforced with a range
of fibre contents (0.3 – 1%), it was decided to continue the
study with 0.3% of fibre per weight in the triaxial tests.
Figure 1. Particle size distribution of CDG.
2.2
Testing apparatus, methods and sample preparation
2.2.1 Uniaxial Compression Test
Unconfined compression tests on CDG and CDG+fibre soils
were performed in a uniaxial compressive testing machine. The
particle sizes passing 2mm diameter sieve were used for
preparing specimens in a 38mm diameter; 76mm height mould
at maximum dry density and optimum moisture content. The
compression tests were performed at 0.5mm/min in all cases.
2.2.2 Triaxial Testing
Drained triaxial tests were performed using a conventional
triaxial apparatus with a computer controlled GDS cell and back
pressure controllers. The shearing tests were performed with a
constant effective stress on specimens of both unreinforced and
reinforced (with polypropylene fibres) CDG soil.
The soil was first soaked in water with a deflocculating
agent and left for air drying, then it was sieved to constituent
particle sizes so that the samples could be prepared in exact
proportion as shown in figure 1, discarding particles above
5mm. Loose specimens were prepared, avoiding macro-voids
and taking care of minimising membrane penetration. The
specimens of 76mm diameter and 152mm height were prepared
in a sample preparation mould.
The samples were saturated under back pressure and the
effective confining pressures ranged from 100 to 500kPa.
Saturation was monitored in each test, ensuring Skempton
B
values of at least 0.92 throughout the testing programme. The
axial strains were measured outside the cell using a standard
displacement transducer. The triaxial tests were run at a low
axial strain rate of 0.01% per minute to ensure no excess pore
pressure development within the sample (this was checked by
measurement at the opposite end of specimen). The membrane
and area corrections were made as per the recommendations
proposed by La Rochelle et al. (1988). The void ratios are
calculated averaging from that obtained by the initial density of
the sample and the final moisture content, taking account of the
measured volume change in all the stages. In all tests the
difference in specific volume compiled was less than 0.02.
3 TEST RESULTS
3.1 Unconfined compressive strength
Representative unconfined compression test results on pure
CDG and CDG + 0.5% fibre are presented in figure 2. The plot
clearly shows that the specimens of reinforced CDG yielded at
very high strain, contributing an additional tenfold strength to
the soil. On the other hand unreinforced CDG yielded at very
low strength (131kPa) and low strain.
Figure 2. Unconfined compression of CDG and fibre-reinforced
CDG.
3.2 Triaxial shearing
Triaxial drained tests were performed on isotropically
consolidated specimens of pure CDG and reinforced CDG
(Table 1). Some specimens were over-consolidated by a ratio of
OCR=5 before being sheared. Details of the tests are shown in
Table 1 (UR and R refer to unreinforced and reinforced
specimens respectively).
Table 1. Summary of the triaxial tests.
Test
v
0
v
c
p
c
'
(kPa)
OCR
UR 100
1.42
1.32
112.0
5
UR 200
1.42
1.37
210.4
1
UR 500
1.48
1.32
499.6
1
R 100
1.58
1.36
98.9
5
R 200
1.43
1.32
202.9
1
R 500
1.58
1.41
499.4
1
The void ratios determined after consolidation (before shearing)
were found to vary between 0.32 and 0.37 for pure CDG
specimens and 0.32 and 0.42 for CDG-fibre specimens. Only
dense specimens were prepared for the test programme. Looser
specimens were difficult to prepare due to the presence of
macro-voids which caused an initial collapse of the specimen,
resulting in void ratios after consolidation within the same range
as those for the dense specimens.
The stress-strain and volumetric responses during shearing
are shown in figure 3. The stress-strain response (figure 3a)
shows that the reinforced specimens generally have higher


