1988
Proceedings of the 18
th
International Conference on Soil Mechanics and Geotechnical Engineering, Paris 2013
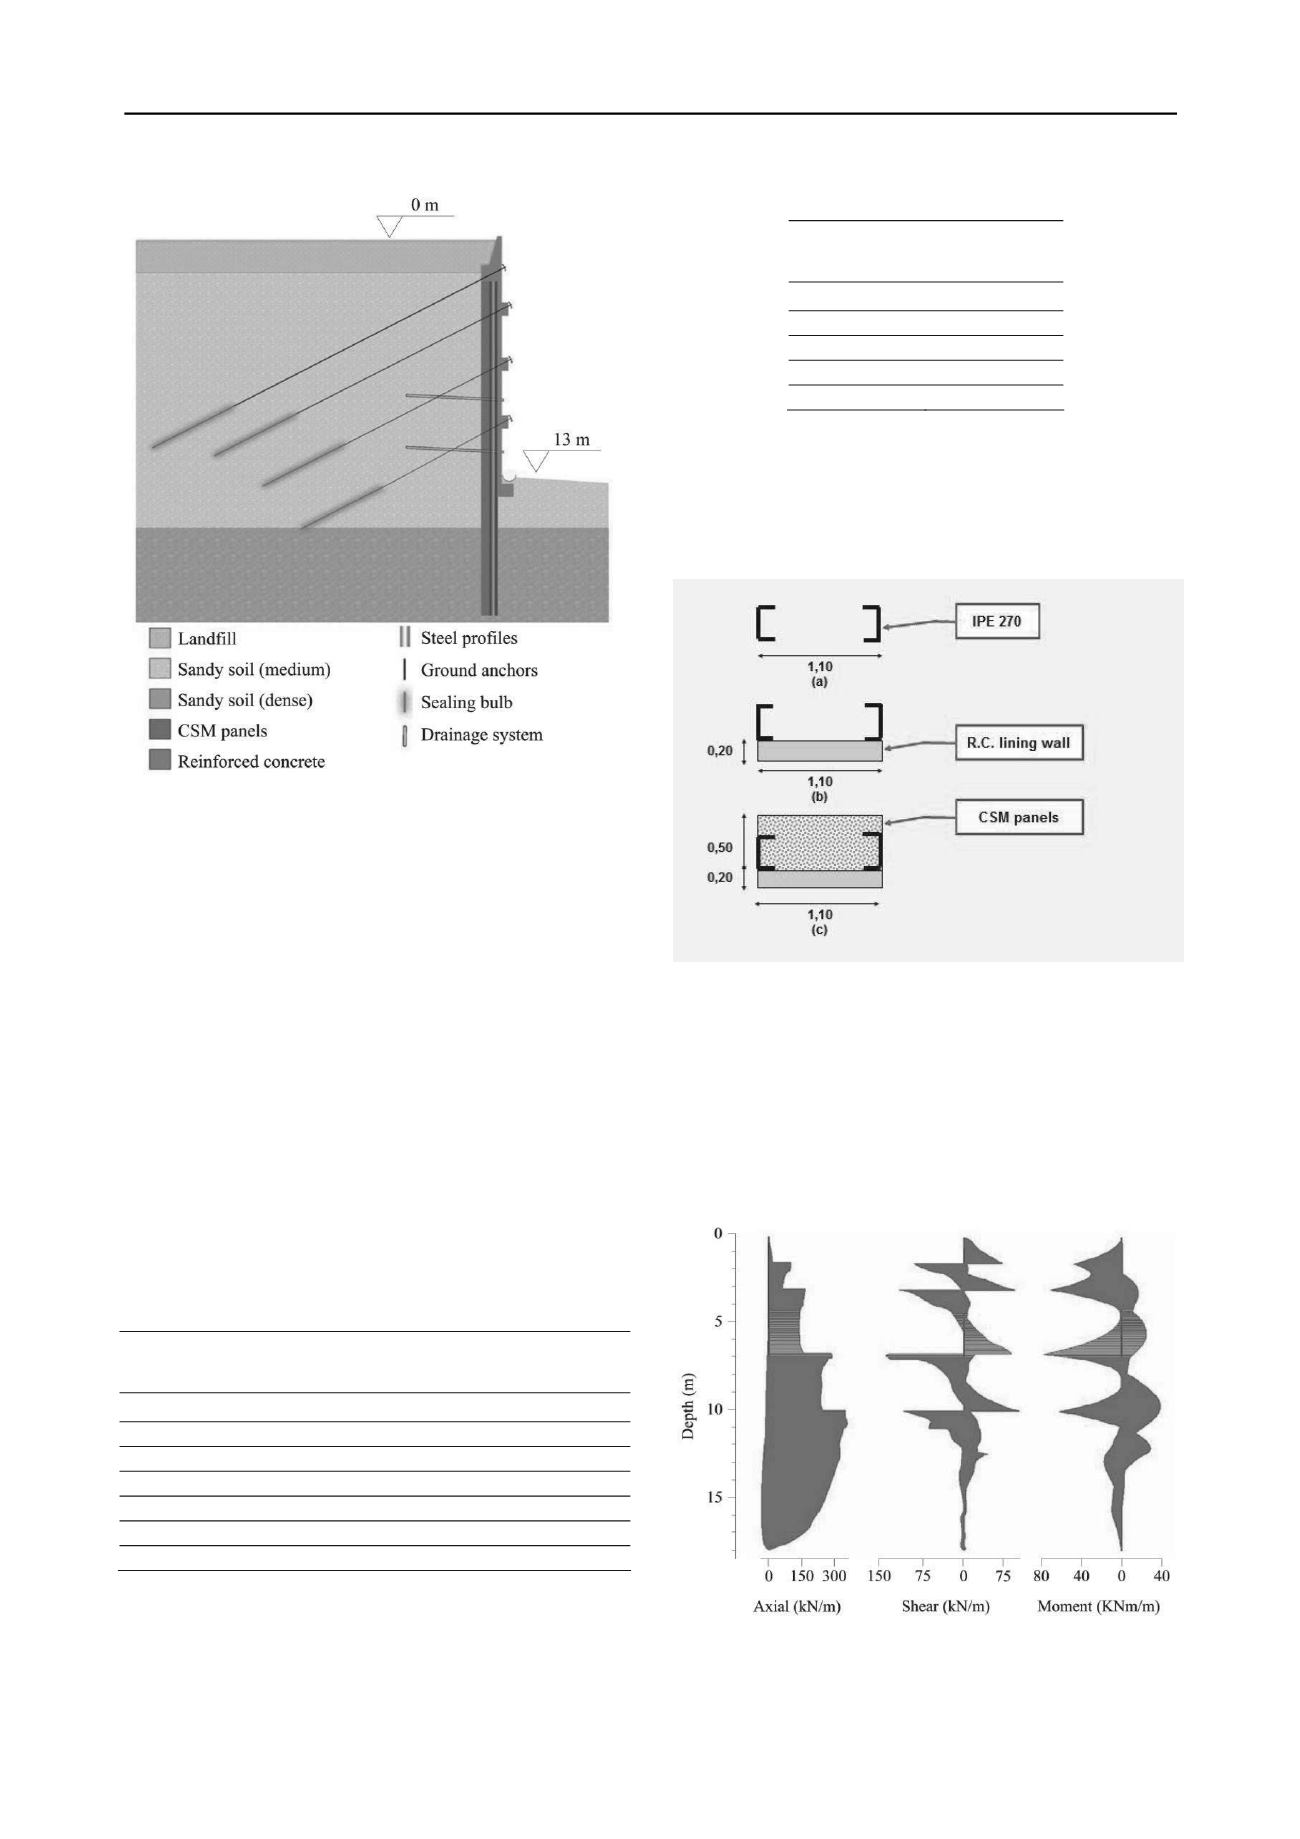
Figure 1. Representative schema of the solution proposed for the
retained wall.
2 SITE AND SUBSURFACE CONDITIONS
The local geological conditions were heterogeneous. The
excavation works intersected, from the surface, heterogeneous
landfills and Miocene medium dense to dense sands and
medium weathered sandstones. The ground water table was
located about 5m above the final excavation level. Taking into
account this scenario, an initial solution of Berlin walls was
considered. A more detailed information about the site and
subsurface conditions can be consulted in Pinto et al (2013).
3 CSM WALL MODELLING AND DESIGN CRITERIA
The modelling work was carried out using the commercial
PLAXIS
®
software. The
Hardening-Soil
model was adopted for
the different soil layers based in the available geotechnical
laboratory and field data and taking into account all the
excavation phases. Table 1 summarizes the main soil
parameters.
Table 1. Main soil properties for modeling.
Constitutive
model:
Hardening-Soil
Landfill
Sandy soil
(medium)
Sandy soil
(dense)
γ
t
(kN/m
3
)
16
17
19
E
50
ref
(kN/m
2
)
10,000
20,000
35,000
E
oed
ref
(kN/m
2
)
10,000
20,000
35,000
E
ur
ref
(kN/m
2
)
30,000
60,000
105,000
Parameter m
0.5
0.5
0.6
c’
0
0
0
φ' (º)
22
33
35
For the soil-cement material produced by the CSM
technology, using a cement consumption ratio of about
600kg/m3, the Mohr-Coulomb constitutive model was adopted
and the parameters summarized in Table 2 were used.
Table 2. Main CSM panels parameters used in the modeling.
Constitutive
model: Mohr-
Coulomb
CSM panels
γ
t
(kN/m
3
)
22
E
ref
(kN/m
2
)
1000000
ν
0.3
c’ (kN/m
2
)
600
φ' (º)
35
With the purpose to approximate the behavior of the
structure to the real behavior , the three configurations shown in
Figure 2 were considered: a) two half vertical IPE270 spaced in
1.1 m, b) two half vertical IPE270 spaced in 1.1 m plus lining
wall and c) two half vertical IPE270 spaced in 1.1 m plus lining
wall and CSM panels.
Figure 2. Configurations adopted in the modeling: a) two half vertical
IPE270 spaced in 1.1 m, b) two half vertical IPE270 spaced in 1.1 m
plus lining wall and c) two half vertical IPE270 spaced in 1.1 m plus
lining wall and CSM panels.
For the structural analysis, load combinations for the
Ultimate Limit State and for the Serviceability Limit State were
defined according to Pereira (2011). The obtained results of 2D
FEM analysis (mesh consisted of plane strain, 15-node
elements) in terms of efforts and displacements are illustrated in
Figure 3 and Figure 4 respectively.
Figure 3. Efforts diagrams.


