1900
Proceedings of the 18t
h
International Conference on Soil Mechanics and Geotechnical Engineering, Paris 2013
-500
-400
-300
-200
-100
0
0
100
200
300
400
500
600
: Observed
: Direct analysis
: Data assimilation
3BC-2
Settlement (cm)
Elapsed time (day)
-500
-400
-300
-200
-100
0
0
100
200
300
400
500
600
: Observed
: Direct analysis
: Data assimilation
3BC-4
Settlement (cm)
Elapsed time (day)
Figure 9. Simulation results using the identified parameters.
0
100
200
300
400
500
0.35
0.40
0.45
0.50
0.55
0.60
: Identified parameter
P
n
= 200
Elapsed time (day)
Compression index,
0
100
200
300
400
500
10
-2
10
-1
10
0
: Identified parameter
Coefficient of permeability,
P
n
= 200
Elapsed time (day)
k
(m/day)
Figure 7. Time evolution of identified parameters.
Each parameter was assumed to follow uniform randomly
and was generated independently. All 200 simulations were
conducted up to 676 days after the construction was started.
Only the settlement values observed on the seabed were used
for parameter identification.
5 CONCLUSIONS
Figure 7 shows the time evolution of the identified
parameters. In the figure, the estimates for
hardly change
through the assimilation. In particular, after the 300
th
day, the
path changes dramatically. On the other hand, in the result of
k
,
the identified parameter shows almost constant value through
the assimilation.
In this study, we have investigated the numerical and the
practical effectiveness of the DA strategies using the PF for
geotechnical problems through their applications to the
hypothetical experiment and the actual construction project.
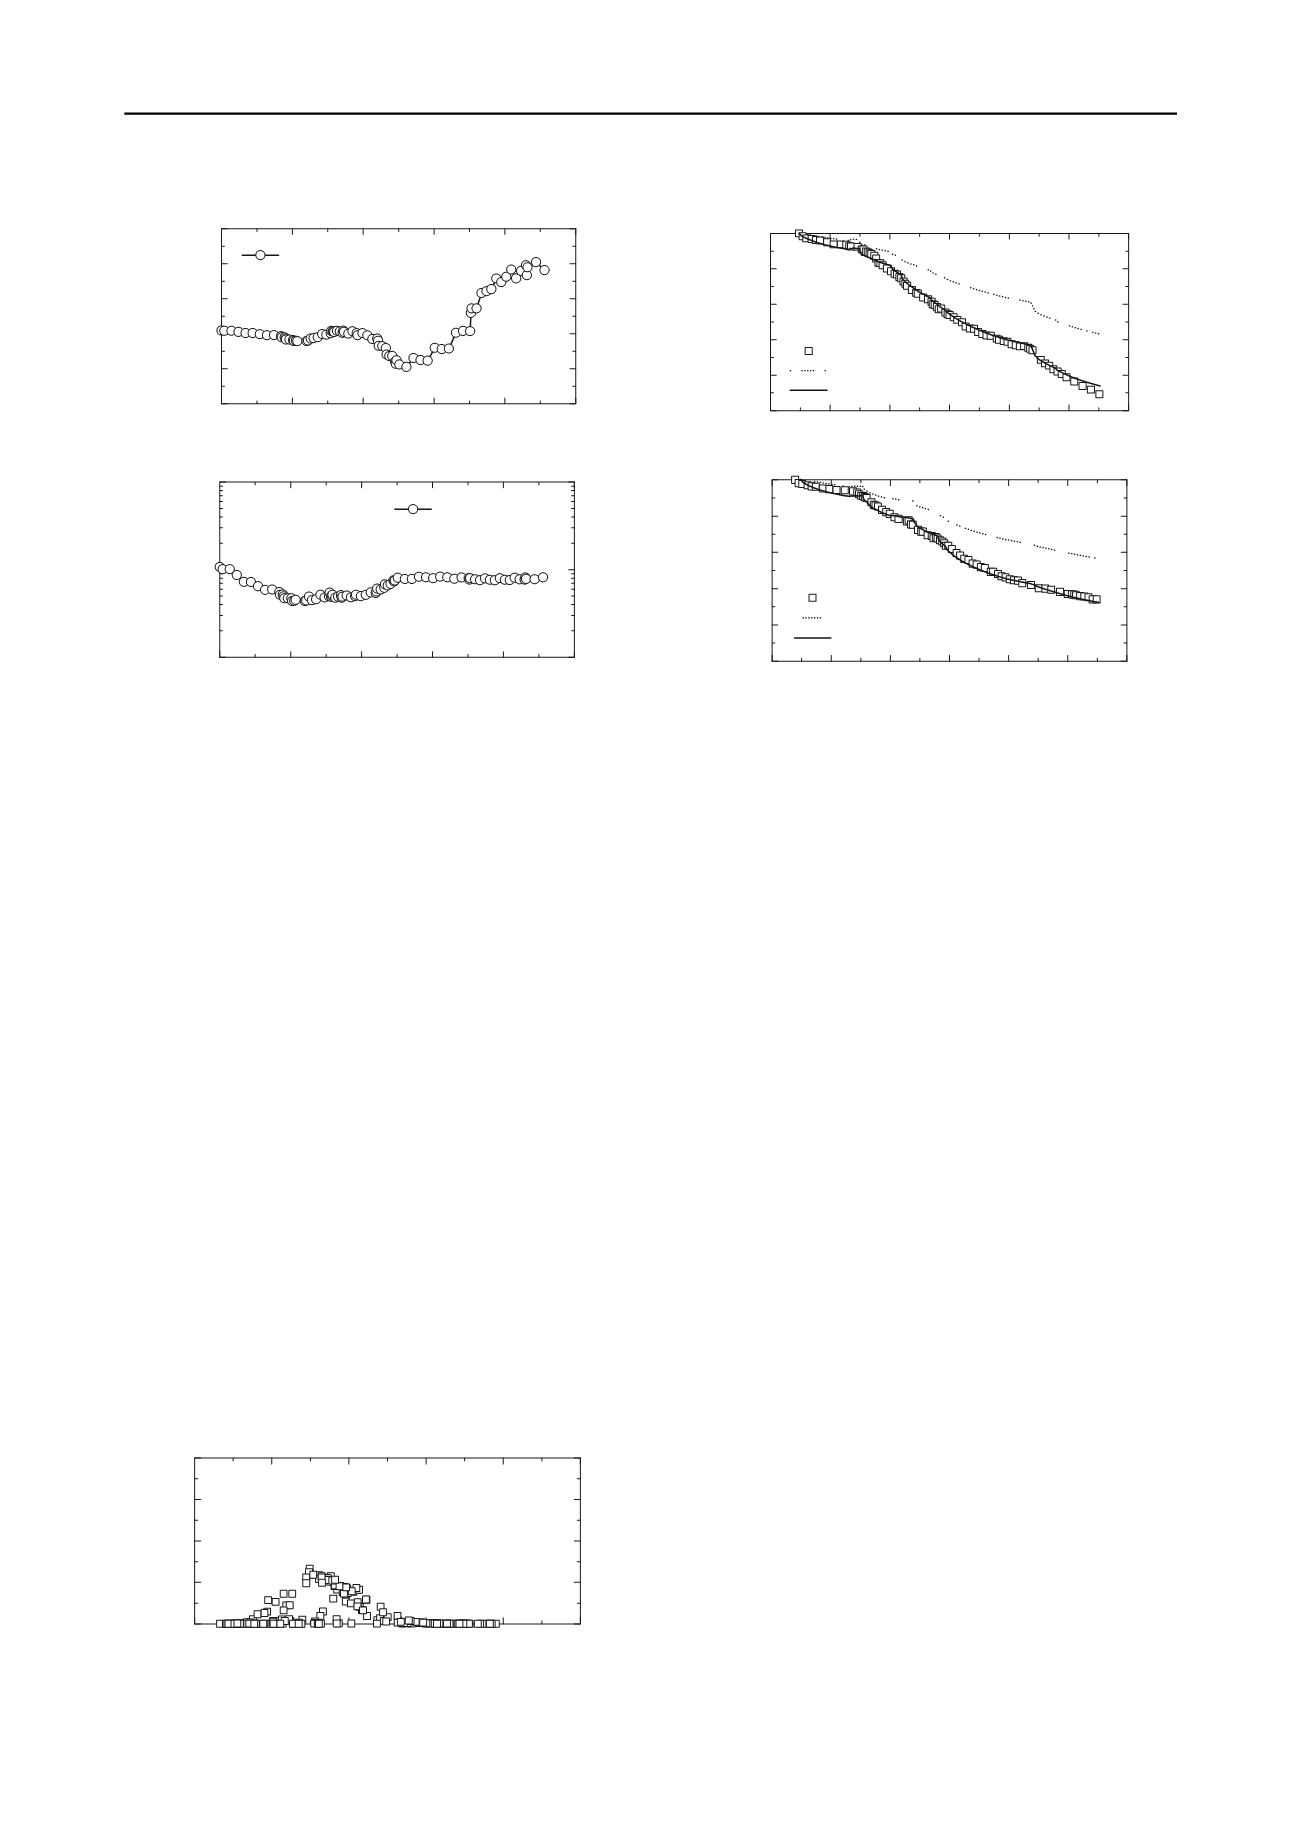
Figure 8 shows filtered PDFs of a settlement value at the 148
days after construction began. In this figure, the vertical axis
represents the weight of the particle, while the horizontal axis
represents settlement value. It can be seen from the Figure 8 that
the distribution of the weight approximately follows the normal
distribution which has sharp peak around -3.5m. From the
result, we can see that the use of a large number of particles
contributes to the accurate estimation of the arbitrary PDFs for
settlements. This is the remarkable advantage of the PF.
The parameters identified by the PF have converged into
their true values, and the presented approach has shown
effective parameter-identification method for elasto-plastic
geomaterials. Moreover, the simulated time-settlement behavior
using the identified mass parameters has provided a good
agreement with the actual observation.
In conclusion, the DA using the PF has been proven a
powerful strategy for identifying elasto-plastic parameters of
geomaterials and more accurate predictions of the mechanical
behavior of geotechnical structures.
6 REFERENCES
The simulation results for the time-settlement relationship at
observation points 3BC-2 and 3BC-4, which were placed on
seabed, via the identified parameters are shown in Figure 9. The
identified parameters mean the values at the end of the
identification process, that is,
t
= 456 days. In the figures, dotted
line represents the result of direct analysis. Although the results
of direct analysis underestimate the observation data, the
simulations using the identified parameters yielded predictions
with high accuracy.
Asaoka A., Nakano M., Fernando G. S. K. and Nozu M. 1995. Mass
permeability concept in the analysis of treated ground with sand
drains,
Soils and Foundations
35 (3), 43-53.
Awaji T., Masafumi K., Ikeda M. and Ishikawa Y. 2009.
Data
assimilation
, Kyoto University Press, 1-11 (in Japanese).
Doucet A., Godsill S. and Andrieu C. 2000. On sequential Monte Carlo
sampling methods for Bayesian filtering,
Statistics and Computing
10, 197-208.
Evensen G. 1994. Sequential data assimilation with a non-linear quasi-
geostrophic model using Monte Carlo methods to forecast error
statistics,
J. Geophys. Res.
99, 10143-10162.
Gordon N. J., Salmond D. J. and Smith A. F. M. 1993. Novel approach
to nonlinear/non-Gaussian Bayesian state estimation,
IEE
Proceedings-F
140 (2), 107-113.
Murakami A., Shuku T., Nishimura S., Fujisawa K. and Nakamura K.
2012. Data assimilation using the particle filter for identifying the
elasto-plastic material properties of geomaterials,
Int. J. Numer.
Anal. Meth. Geomech
., DOI:10.1002/nag.2125.
Nakamura K., Ueno G. and Higuchi T. 2005. Data assimilation: concept
and algorithm,
Proc. Inst. Statist. Math.
53 (2), 37-55 (in Japanese).
Yamamoto T., Sakagami T., Takahashi Y., Yagiura Y., Nambu M. and
Iizuka A. 2010. Establishment of soil deformation analysis method
at Kobe Airport,
Doboku Gakkai Ronbunshuu C
66 (3), 457-471 (in
Japanese).
-5.0
-4.0
-3.0
-2.0
-1.0
0.0
0.00
0.02
0.04
0.06
0.08
3BC-2
P
n
= 200
t
= 148 days
Settlement (m)
Weight
Figure 8. Filtered PDF of a settlement value.


