1892
Proceedings of the 18t
h
International Conference on Soil Mechanics and Geotechnical Engineering, Paris 2013
Proceedings of the 18
th
International Conference on Soil Mechanics and Geotechnical Engineering, Paris 2013
ground, we studied the difference from the deformation
evaluated by using all inclinometers, based on the field data
mentioned in the previous section.
The number of used inclinometers in this simulation is 4 at
1st step, 12 at 2nd step and 20 at 3rd step. In this simulation,
the data obtained from the survey using T.S. was also
considered from 1st step.
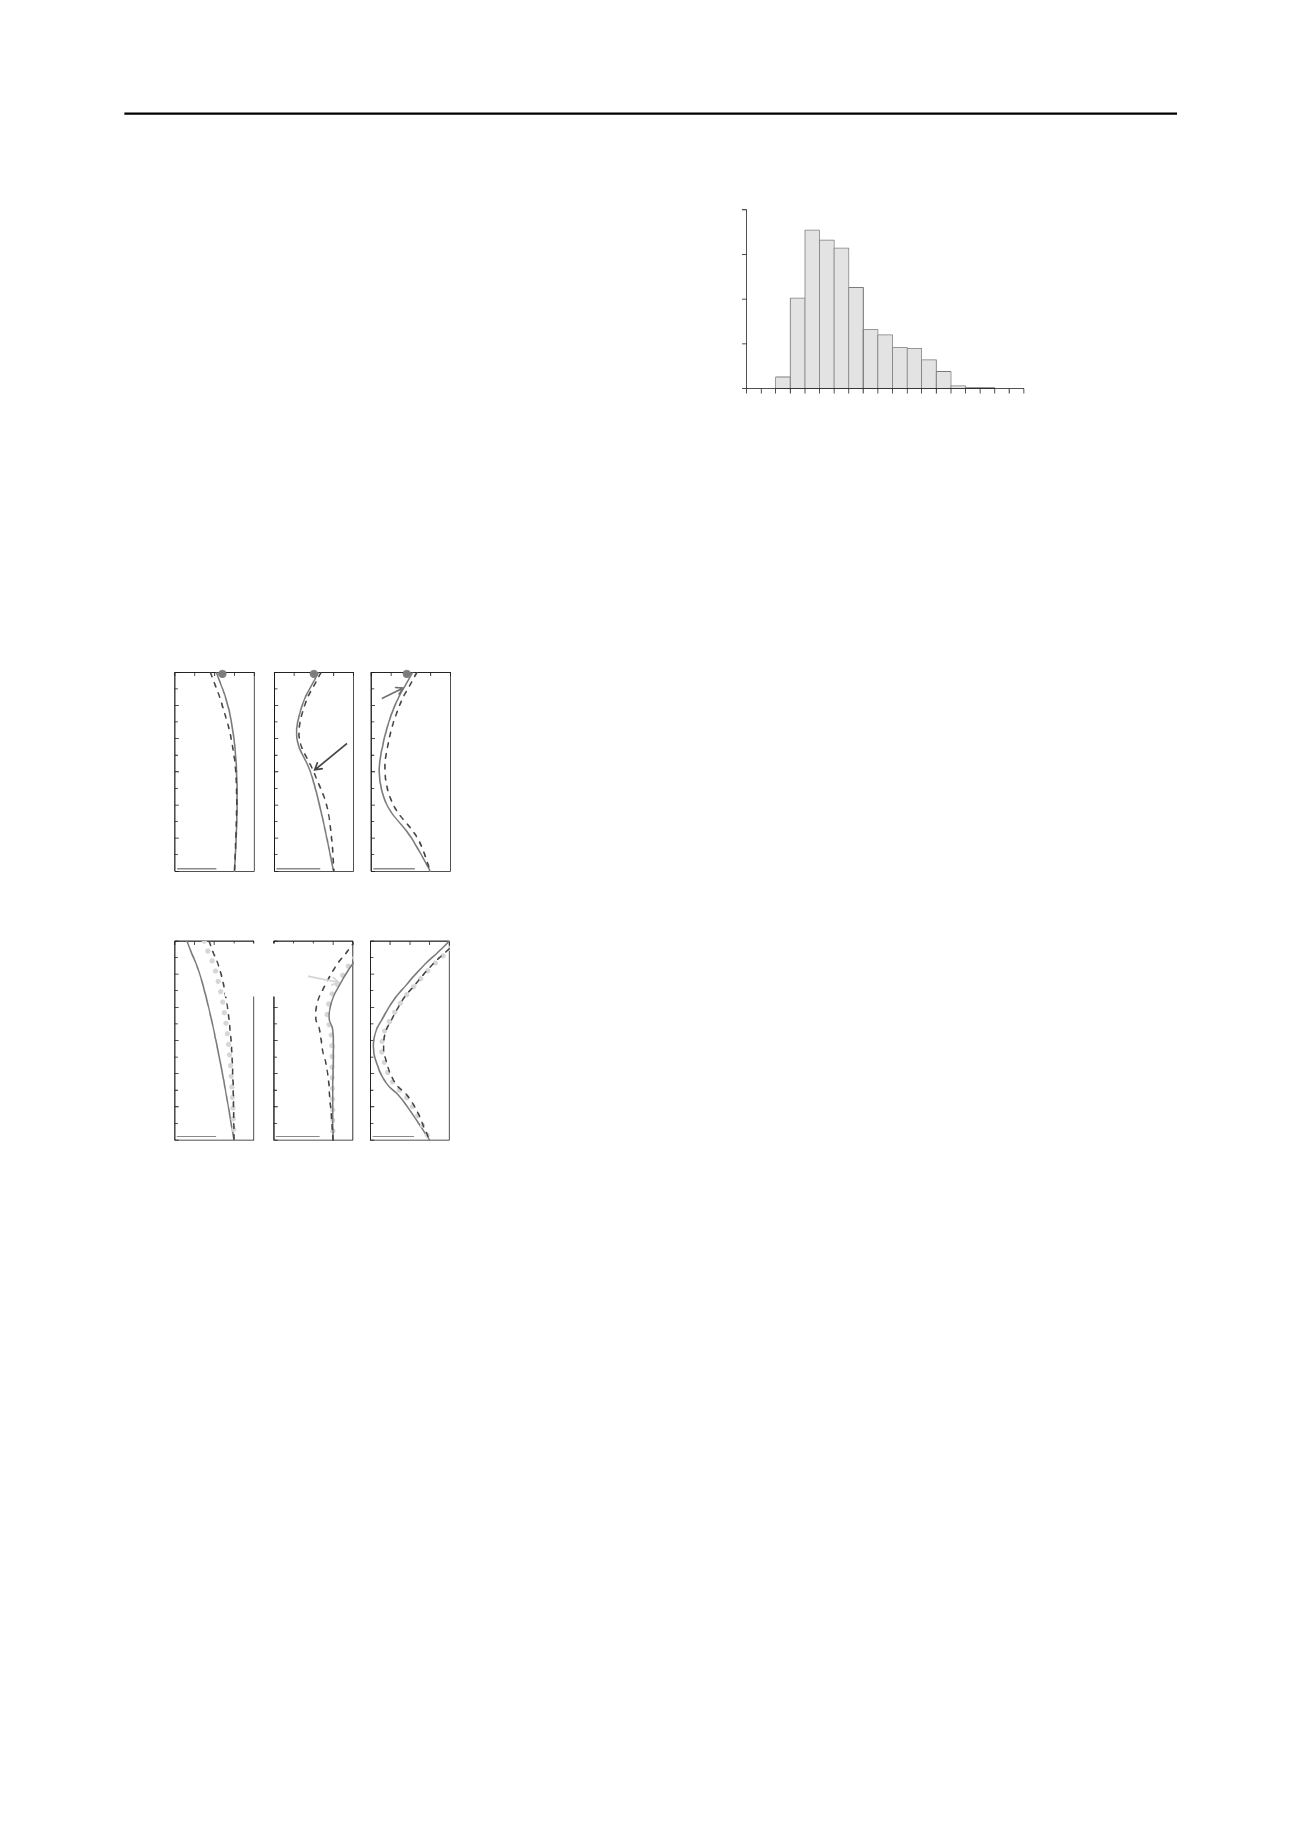
Figure 10 shows the distributions of the displacement of the
wall. The displacement at Line No.1 was quite similar with the
one using all inclinometers, CASE1 in previous chapter. On the
other hand, the displacement at Line No.4 was quite different
because the direct measurement of displacement by T.S. was
not conducted around Line No.4. So, we also simulated the
monitoring case using multi-element inclinometers were added
at Line No.3. The displacement almost coincided with the
results using all inclinometers.
In monitoring of field excavating work, direct measurement
of displacement or installation of one line for multi-
inclinometers would enable the measurement using convenient
inclinometers.
(a)Line No.1
(b)Line No.4
Figure 10. Distributions of displacement at cross section.
5.2
Study of optimal arrangement of convenient inclinometers
Finding optimal arrangement for conventional inclinometers
would be executed by evaluating of degree of accuracy and
choosing the most suitable surface for all considerable
arrangements. Therefore, we conducted the simulation the
accuracy of evaluated surface by iterative calculation.
Monte Carlo approach was adopted for iterative calculation
and the number of iteration was 1000. The step of excavating
work selected for calculation was 3rd step. For the simulation,
the surface was evaluated by 8 inclinometers selected from 20
ones above the ground at random.
Figure 11 showed the obtained histogram. The horizontal
axis is the evaluated average difference (Matsumaru et. al.,
2011) from the surface simulated by using all inclinometers. It
was revealed that the accuracy of evaluated deformation of the
wall changed largely depending on the arrangement of
inclinometers. However, the minimum of the difference was
smaller than 1 mm. This mentioned that the monitoring using
small number of measurement equipments had the possibility to
maintain the accuracy of measurement depending on the
arrangement. By conducting iterative calculation about
considerable arrangement, the optimal arrangement would be
realize.
Figure 11. Histogram of average difference for considerable
arrangements.
6 CONCLUSIONS
The purpose of this paper was system to evaluate and visualize
deformation of retaining wall as three-dimensional curved
surface. As the results, we achieved the following conclusions:
1. We developed a system adopting the cubic B-spline function
as analytical technique and also proposed a method to evaluate
inclinometer data as surface without transform inclines into
displacements. The validity of the method was confirmed by
the simulation of the loading tests of the model wall, because
correct surfaces were droved using a small amount of data of
displacement or using only inclines.
2. The adequacy of the proposed system was examined by
applying this method to measurement of the field site of
excavating work. From the beginning to the end of the work,
the deformation of the wall was represented satisfactorily as
three-dimensional surface. Furthermore, it was revealed that
the evaluated deformation of the wall coincided with the
surveyed displacement by the total station.
3. In order to realize easy monitoring of retaining walls, we
checked the arrangement of inclinometers. By using the
inclinometers installed above the excavation bottom, the
deformation of the wall could be described almost in the same
way as by all inclinometers. Furthermore, we checked the
validity of the arrangement with smaller number of
inclinometers by Monte Carlo approach. Though the evaluated
deformation of the wall using smaller number of inclinometers
was varied widely, the accuracy of the optimal arrangement
was close to the one using all inclinometers.
7 ACKNOWLEDGEMENTS
The field measurement in this study was supported by Mr.
Kiyoshi Kuwabara (East Japan Railway Co. Ltd) and Toshiyasu
Hisasshima (East Japan Railway Co. Ltd).
8 REFERENCES
Matsumaru T., Tanaka Y., Suga M., Oji S. and Onishi T. 2011. Study of
measurement method for constructing underground structure using
three-dimensional evaluation system of measurement data,
Proceedings of the 43th Japan National Conference of
Geotechnical Engineering
. (CD-ROM, in Japanese)
Nonogaki, S., Masumoto S. and Shiono, K. 2008. Optimal
determination of geology boundary surface using cubic B-spline,
Geoinformations
, Vol.19, No.12, pp.61-77.
Shiono K., Noumi Y., Masumoto S., and Sakamoto M. 2001,
Horizon2000 : revised fortran program for optimal determination of
geologic surfaces based on field observation including equality-
inequality constraints and slope information,
Geoinformations
,
Vol.12, No.4, pp.229-249.
-12
-10
-8
-6
-4
-2
0
-5 0 5 10 15
深度 [
m
]
Disp.
[
mm
]
-12
-10
-8
-6
-4
-2
0
-5 0 5 10 15
深度 [
m
]
Disp.
[
mm
]
-12
-10
-8
-6
-4
-2
0
-5 0 5 10 15
Depth.
[
m
]
Disp.
[
mm
]
CASE1
24 inclinomerers
1st step
2nd step
3rd step
TS
Inclinometers
ahove ground
-12
-10
-8
-6
-4
-2
0
-5 0 5 10 15
深度 [
m
]
Disp.
[
mm
]
-12
-10
-8
-6
-4
-2
0
-5 0 5 10 15
深度 [
m
]
Disp.
[
mm
]
-12
-10
-8
-6
-4
-2
0
-5 0 5 10 15
Depth
[
m
]
Disp.
[
mm
]
1st step
2nd step
3rd step
Multi-element
inclinometers
at Line No.3
0
50
100
150
200
0 1 2 3 4 5 6 7 8
Frequency
Difference from detailed measurement
(
mm
)


