1891
Technical Committee 206 /
Comité technique 206
Proceedings of the 18
th
International Conference on Soil Mechanics and Geotechnical Engineering, Paris 2013
4 ADOPTATION OF PUROPOSED METHOD FOR FIELD
MEASUREMENT
4.1
Field condition of construction and measurement
Figure 7 shows the field conditions of construction and
arrangement of measurement equipment. The excavating work
was conducted 39 m times 16 m in area, and 9 m in depth. The
surface layer of the ground was a very soft alluvial clay layer
about 13m in thickness, with a small N-value of SPT, followed
by a gravel layer. The type of the retaining walls was bracing
method. The materials of the walls were steel sheet piles. The
excavation consisted of three steps as shown in figure 7.
Monitoring the wall was conducted at the south section in
order to keep safe the existing tunnel for cars. Monitoring was
implemented by multi-element inclinometers. As shown in
figure 7, there were four survey lines and six inclinometers were
set on each line. For checking monitoring data, the survey of the
displacement of the wall using the total station was also
conducted at regular intervals around Line No.1 and Line No.2.
Evaluating and visualizing the deformation of the wall in 3-
dimensional space was conducted in the region about 33.4m in
width. Two arrangements of the measurement equipments were
considered. CASE1 was the arrangement using only 24 multi-
element inclinometers. CASE2 was using not only
inclinometers but also the displacement obtained from the
survey using T.S.
Figure 7. Conditions of field construction and measurement.
4.2
3-dimensional evaluation and visualization of
deformation of retaining wall
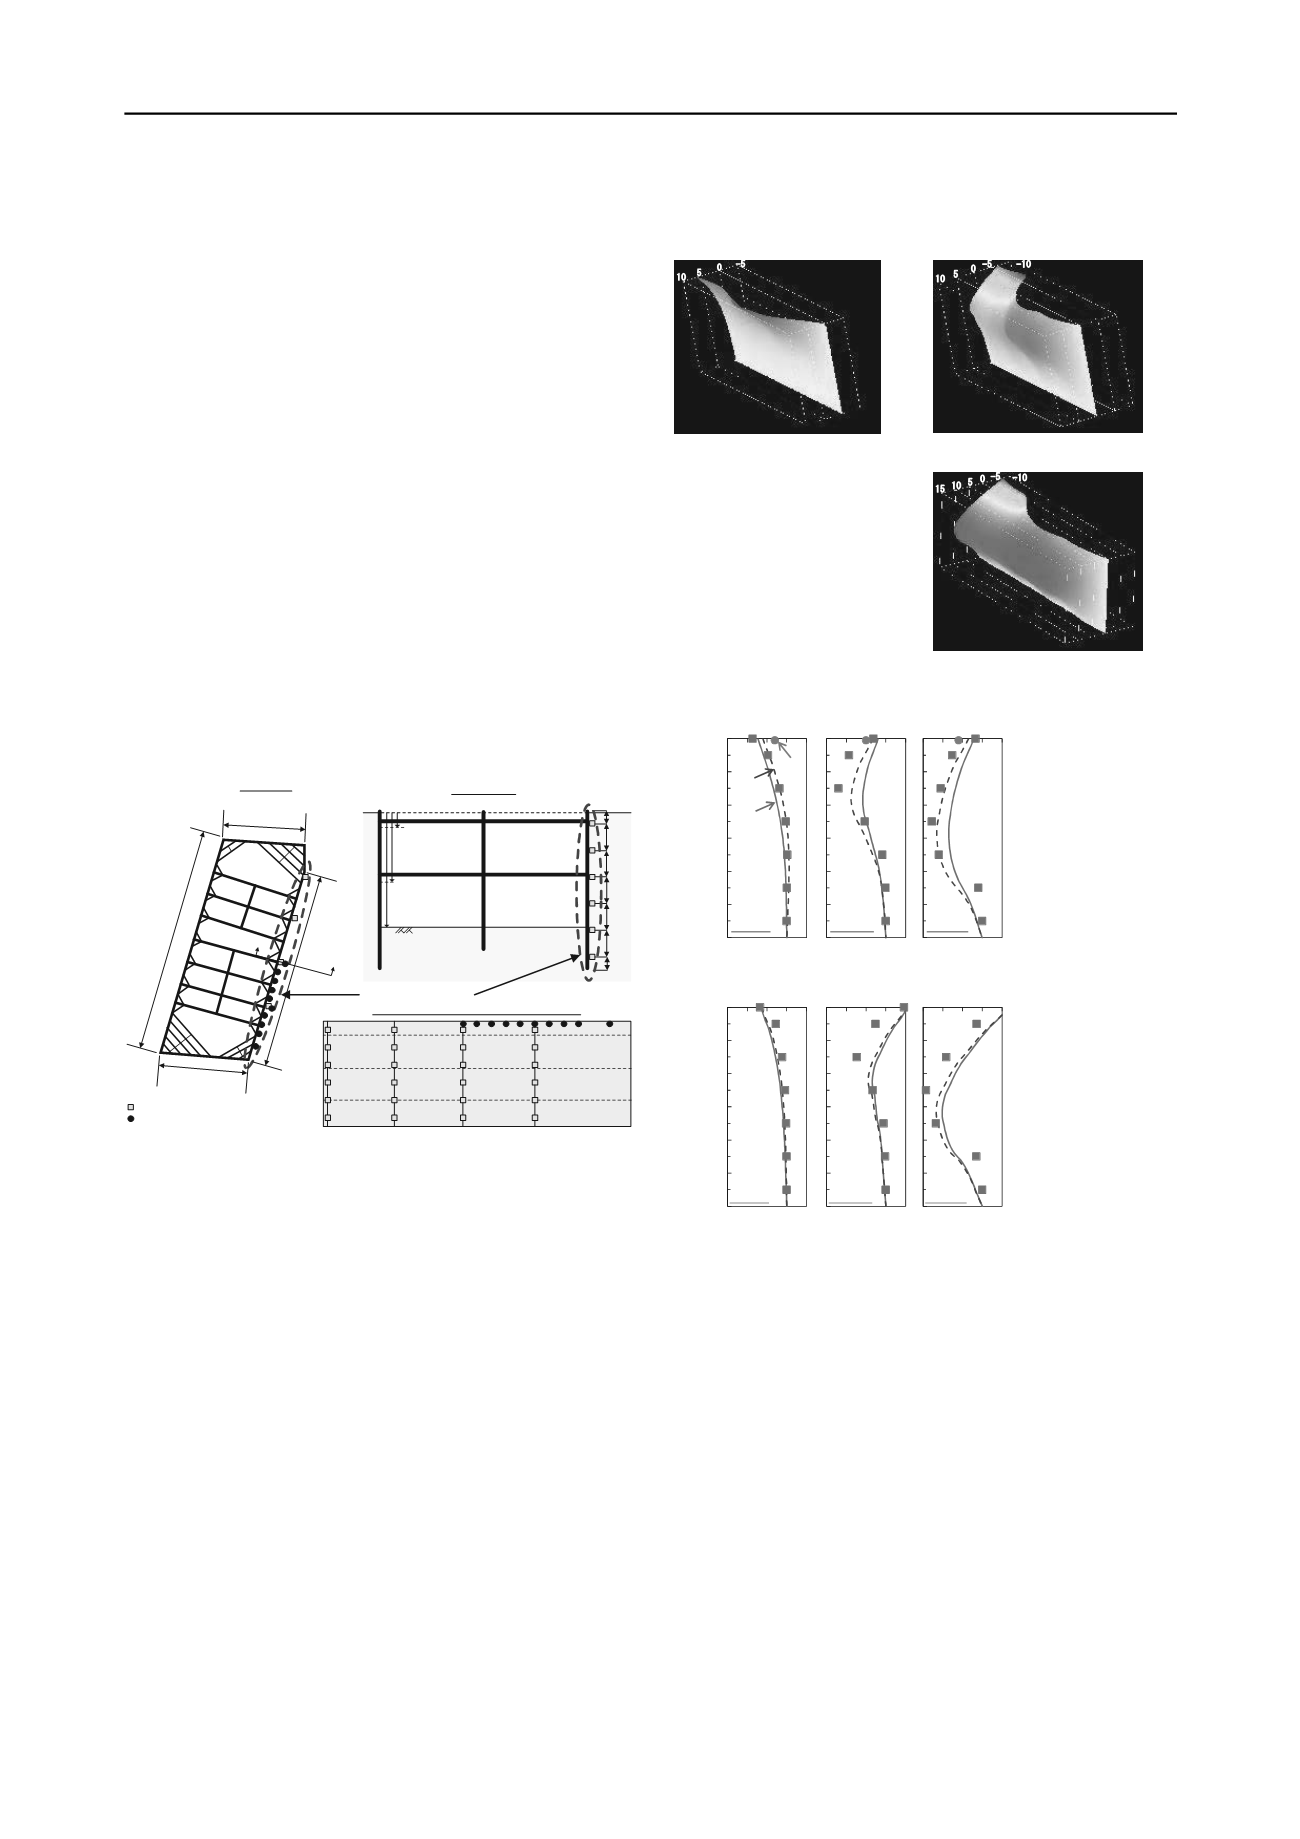
Figure 8 shows the deformed wall which was evaluated and
visualized after conducted excavation at each step in CASE1.
From the beginning to the end of the work, the deformation of
the wall was represented satisfactorily as 3-dimensional surface.
The deformation was increased as the progress of the
excavating work. On the other hand, as the progress, the depth
where the maximum displacement occurred at deeper depth and
the deformation close to the ground level was decreased due to
the influence of the reaction force by installing braces.
Figure 9 shows the distributions of deformation at the cross
section No.1 and No.4 as shown in figure 7. In this figure, we
also showed the displacement converted from the angle
obtained from inclinometers and the distances between two
inclinometers, and the displacements obtained from the survey
by T.S. The distributions of displacement evaluated by
proposed method coincides with the mode of directly measured
deformation. The displacement obtained from the proposed
method was more smoothed. Furthermore, the distributions of
displacement were changed largely depending on use of results
obtained from survey by T.S. In this simulation, this tendency
was dramatic at section No.1, where lots of targets for survey of
T.S. were located. The displacement evaluated using the targets
changed toward the displacement obtained from the survey at
the top of the wall.
(a) 1st step
(b) 2nd step
Figure 8. Deformation of wall at
each step
(c) 3rd step
(a)Line No.1
(b)Line No.4
Figure 9. Distributions of displacement at cross section.
From these results, the proposed method was proved to be
beneficial for field measurement.
5 ADOPTATION OF PROPOSED METHOD FOR FIELD
MEASUREMENT
From the study mentioned in previous sections, the validity of
the proposed method was confirmed. The advantage of this
method is that the data obtained from inclinometers is useful
without converting to displacement. So, we can conduct the
measurement using convenient inclinometers without making
survey line. Therefore, by combining the proposed method and
simple inclinometers, we would be able to realize precise and
not expensive measurement. However, there are some problems
in this method.
5.1
Study of using data only upper ground
For the measurement using convenient inclinometers, it seems
to be difficult to set inclinometers under the ground. The
inclinometers will be set as the progress of excavating work. So,
in the case only using the inclinometers located above the
33.4m
1m
2m
2m
2m
2m
2m
1m
A
A
’
A
A’
Plane map
A-A’ section
3rd step
:
9m
2nd step
:
5.5m
1st step
:
1.5m
Section for analysis
39.2m
14.8m
15.9m
(East
)
(West
)
(North)
(South)
Multi-element inclinometers
Arrangement of measurement equipments
Target for survey of displacement
3rd step
:
9.0m
2nd step
:
5.5m
1st step
:
1.5m
Line No.1
Line No.4 Line No.3 Line No.2
(East)
(West)
(North)
(South)
-12
-10
-8
-6
-4
-2
0
-5 0 5 10 15
深度 [
m
]
Disp.
[
mm
]
-12
-10
-8
-6
-4
-2
0
-5 0 5 10 15
深度 [
m
]
Disp.
[
mm
]
-12
-10
-8
-6
-4
-2
0
-5 0 5 10 15
Depth
[
m
]
Disp.
[
mm
]
CASE1
CASE2
1st step
2nd step
3rd step
TS
-12
-10
-8
-6
-4
-2
0
-5 0 5 10 15
深度 [
m
]
Disp.
[
mm
]
-12
-10
-8
-6
-4
-2
0
-5 0 5 10 15
深度 [
m
]
Disp.
[
mm
]
-12
-10
-8
-6
-4
-2
0
-5 0 5 10 15
深度 [
m
]
Disp.
[
mm
]
1st step
2nd step
3rd step
5
0
10
-5
5
0
10
-5
-10
5 0
10
-5 -10
15


