1881
Technical Committee 206 /
Comité technique 206
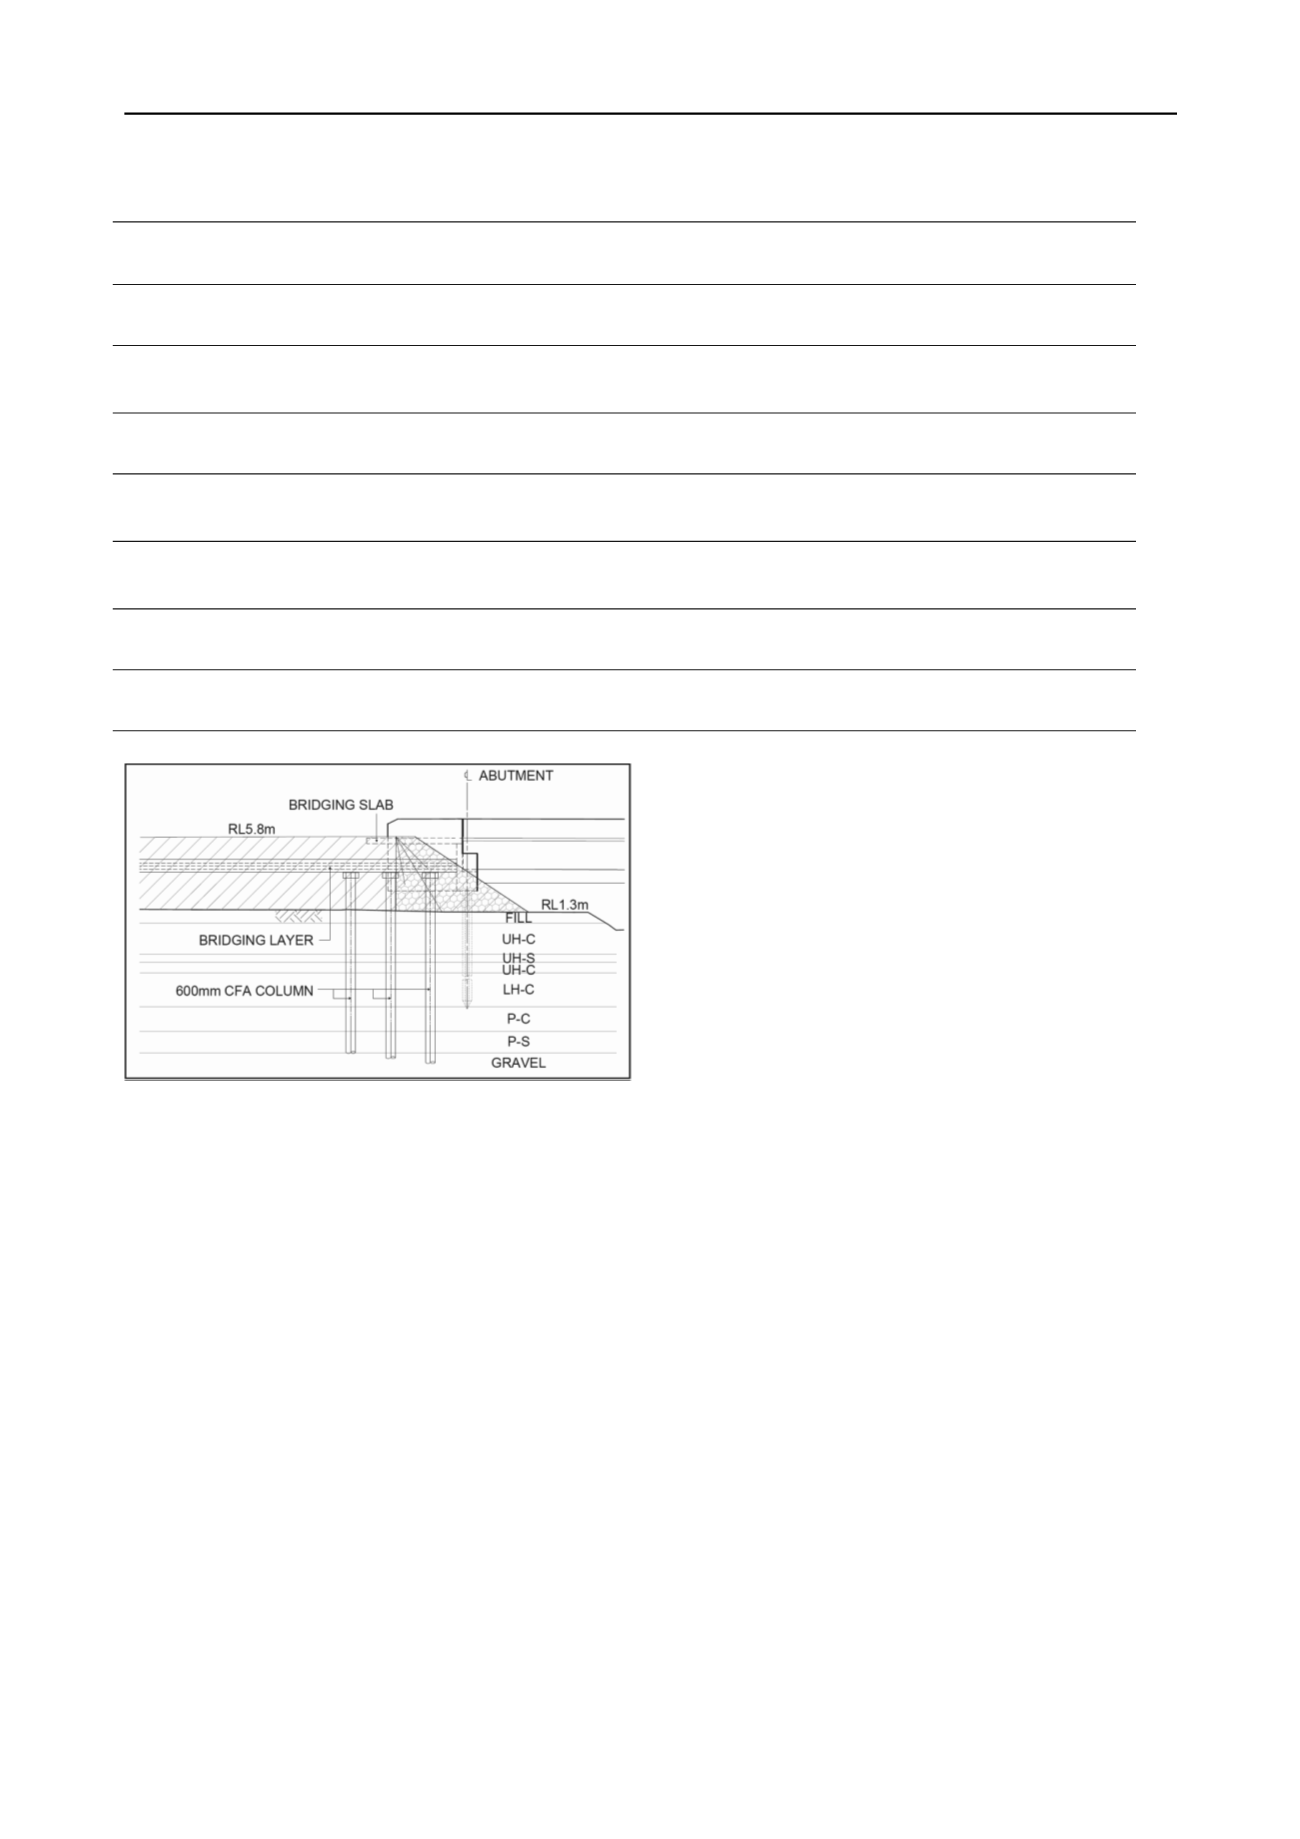
Figure 3: Typical operational stage bridge approach transition
design arrangement proposed during Stage 1
location at the conclusion of the 10 years maintenance period in
combination with 0.5% change in grade on the pavement
surface, 6 months preloading with surcharge was proposed
(refer section 3). Methodology for settlement assessment and
calculation was undertaken in accordance with the method
outlined by Hsi
et al.
(2008). Permeability numerical matching
technique (Hird
et al.
1992) was adopted to model the
consolidation behaviour of wick drains in plain strain FEA
using PLAXIS.
Suitability of the CFA column arrangement was evaluated
using PLAXIS by comparing the predicted principal stresses
with the allowable compression and tensile strength.
Unreinforced CFA columns were modelled as non-porous
elastic-perfectly plastic model with a tension cut-off at its
tensile strength and plasticity parameters were obtained from
compressive and tensile strengths.
In PLAXIS analysis, the two-dimensional stresses were
converted into principal stresses (
1
' and
3
') in the two major
and minor principal axis directions. The major principal stress
value (
1
') was compared with the factored unconfined
compressive strength (UCS) and factored tensile capacity of
concrete. A factor of safety of 2 was adopted for both
compressive and tensile strengths. Structural adequacy was
considered to be met if the principal stresses induced in the
columns were less than the respective compressive and tensile
capacities.
Soil structure interaction of bridge approach transition
treatment was analysed in PLAXIS. The prescribed settlement
method was used to analyse the differential settlement within
the transition zone due to creep effect. Post construction creep
settlement was firstly estimated. Subsequently, the ground
behind the CFA columns was then prescribed to settle by an
amount equal to the estimated post construction settlement. The
embankment change in grade over any 4m length of pavement
due to differential settlement was then calculated.
To meet the stability criteria (minimum safety factor of 1.2
in short term and 1.5 in long term), the embankment
construction was constrained at a rate of 1m per week.
Accordingly, strength gains due to consolidation of the UH-C
and LH-C layers were able to be considered in the design. Time
rate of consolidation of the UH-C and LH-C layers was further
accelerated by use of PVD’s. High strength geotextile in
combination with lateral stability berms was utilised to provide
additional stability control during construction. Stability
analysis and design of soil reinforcement were carried out in
accordance with the method outlined in Hsi and Martin (2005).
4.2
Stage 2 methodology
Stage 2 involved constructing the embankment using the design
arrangement in combination with monitoring of the actual
embankment performance during the preload period based on an
observational approach. The objective of Stage 2 was to validate
the design assumptions and ensure the safe and economical
construction of the embankment by controlling the filling rate.
Two settlement plates and markers, one vibrating wire
piezometer, three inclinometers and one extensometer were
implemented at BR25A to monitor the embankment
performance during filling and preloading.
4.3
Stage 3 methodology
Conducted in parallel with Stage 2, Stage 3 involved back
analysis during construction to validate the proposed transition
design with respect to the settlement criteria. Additionally, the
predicted date of preload removal was refined and investigation
into opportunities to optimise the design from a cost and time
perspective was undertaken. Back analysis was conducted using
actual construction stage monitoring data.
To validate the magnitude of primary settlement, back
analysis comprised initial modelling of the actual rate of
Table 1: Geotechnical Design Parameters
Layer
Depth (top
of layer)
γ
t
c’
Φ’
E’
υ
OCR
C
cε
C
rε
C
αε
c
v
(m)
(kN/m
3
)
(kPa)
(
)
(MPa)
(m
2
/yr)
Fill
0.0
16.5
(16.5)
0
(0)
30
(30)
15
(15)
0.3
(0.3)
-
-
-
-
-
UH-C
0.5
17.0
(17.0)
2
(2)
27
(27)
-
-
2.5
(2.5)
0.3
(0.2)
0.03
(0.03)
0.01
(0.01)
6.0
(3.0)
UH-S
5.2
17.0
(17.0)
0
(0)
30
(30)
10
(10)
0.3
(0.3)
-
-
-
-
-
UH-C
5.5
17.0
(17.0)
2
(2)
27
(27)
-
-
2.0
(2.0)
0.3
(0.2)
0.03
(0.03)
0.01
(0.01)
6.0
(2.5)
LH-C
8.0
17.0
(17.0)
2
(2)
27
(27)
-
-
1.5
(1.5)
0.3
(0.2)
0.03
(0.03)
0.018
(0.01)
2.5
(1.5)
P-C
20.5
17.0
(17.0)
2
(2)
27
(27)
15
(15)
0.3
(0.3)
-
-
-
-
-
P-S
21.9
19.0
(19.0)
0
(0)
38
(38)
40
(40)
0.3
(0.3)
-
-
-
-
-
Note: Figures shown in brackets are values used in back analysis


