1910
Proceedings of the 18t
h
International Conference on Soil Mechanics and Geotechnical Engineering, Paris 2013
changes in response to different loading. When a force is
applied to the sensor, the analog-to-digital converter assigns a
digital output (DO) value between 0 and 255 (i.e., 8-bit
resolution) to each sensel, depending on the corresponding
impedance value. This DO can then be correlated to the
pressure or other engineering units through calibration.
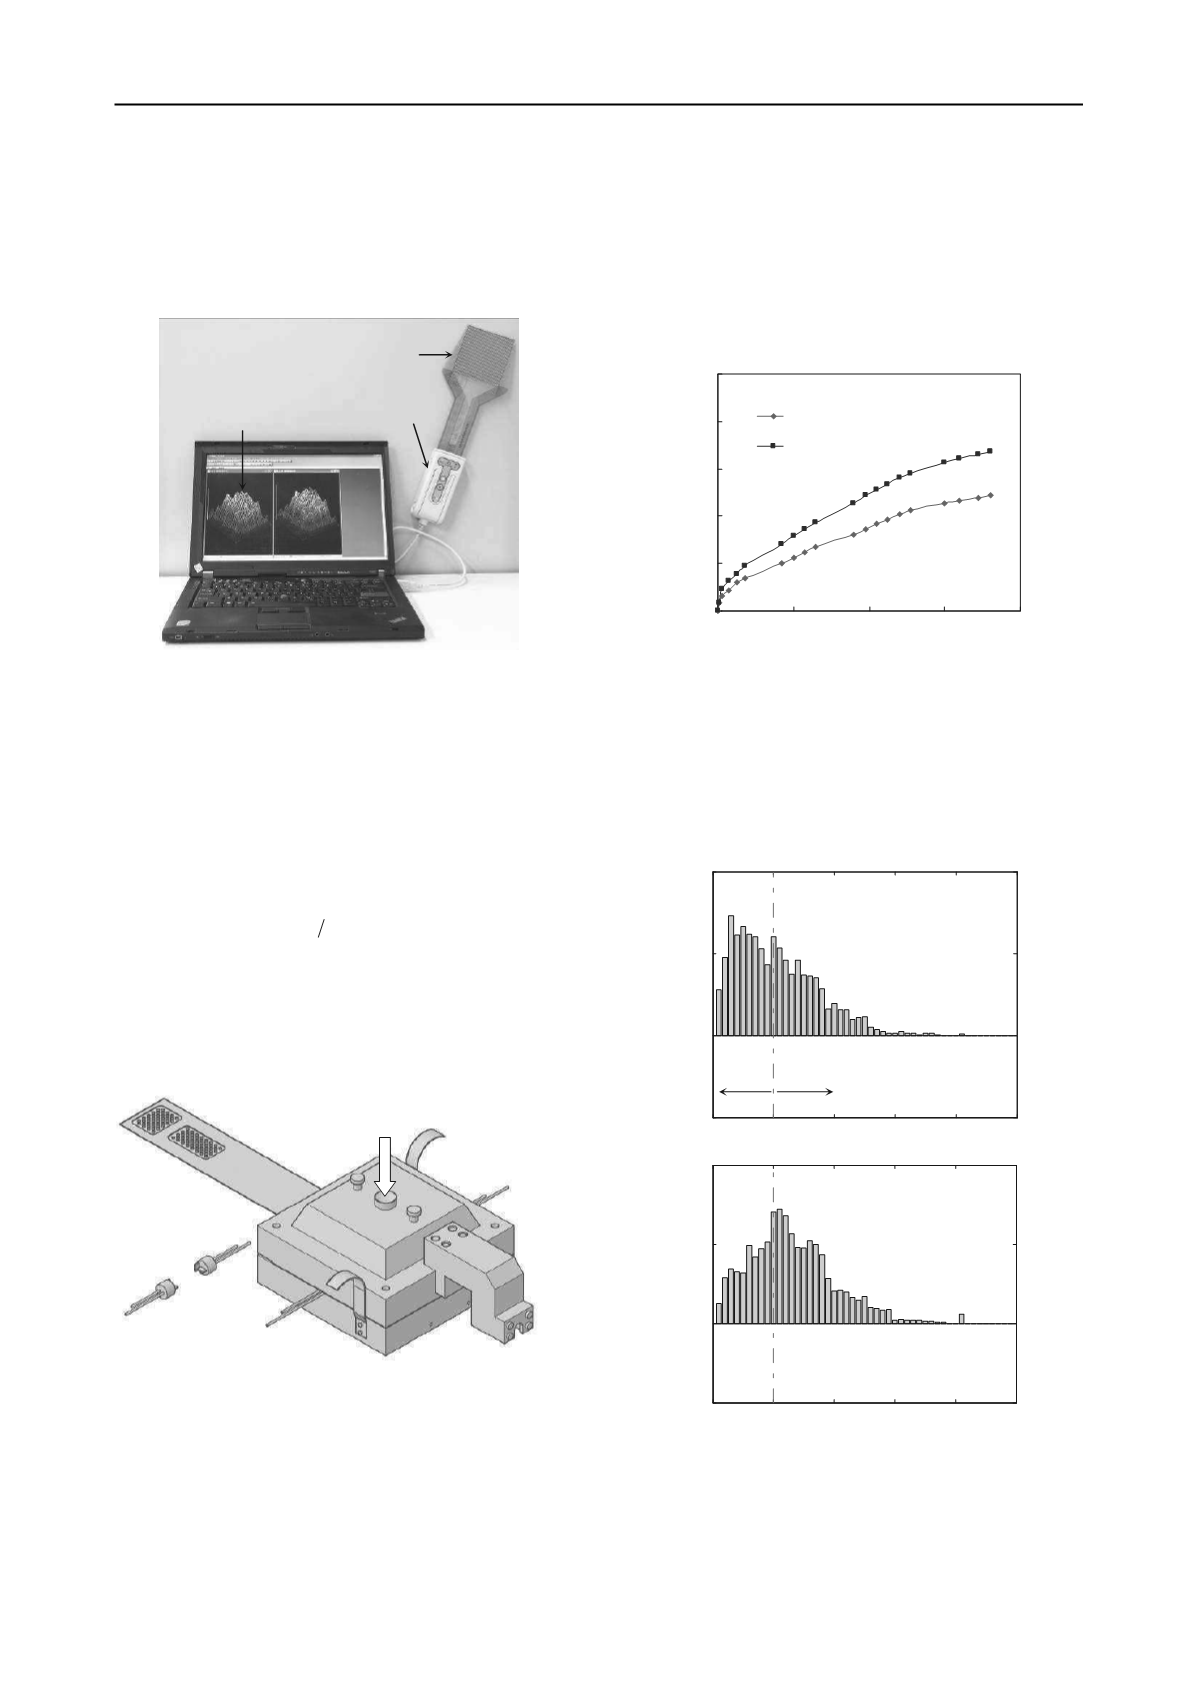
Figure 1. The I-Scan system.
2.2 Experimental setup and plan
Fig. 2 presents the experimental setup. A tailor-made oedometer
with inner dimensions of 100
100
40
mm
was used. Two
sets of bender elements were utilized to obtain the small-strain,
shear moduli
G
hv
and
G
hh
, where the first and second subscripts
specify the directions of wave propagation and polarization,
respectively;
h
means the horizontal direction and
v
stands for
the vertical direction. Each set of bender elements consisted of
one source and one receiver. The distance
d
between the source
and the receiver is fixed at 80 mm throughout the test. The
corresponding shear wave velocity
V
s
and shear modulus can be
derived by
2
2
td
V G
s
where
ρ
is the soil density. The
tactile pressure sensor was put between the upper and bottom
box to measure the stress distribution inside soils. The
calibration of tactile sensors including the creep (or drift) effect
followed the procedure suggested by Gao and Wang (2012).
The testing material was dry Leighton Buzzard sand (fraction E).
Figure 2. Experimental setup.
During the aging process, the applied vertical stress onto the
sand sample was kept constant at
v
=197.21 kPa for three days.
The associated shear modulus changes was continuously
monitored using the bender element tests and the evolution of
contact normal forces among particles was constantly
characterized by the tactile pressure sensor and the I-scan
system.
2.3 Experimental results and discussion
Fig. 3 presents the variations in G
hv
and G
hh
during the aging
process. The variations are presented in terms of the modulus
change, i.e., (
G
t
–
G
in
)/
G
in
where
G
t
and
G
in
are the moduli at
any time
t
and at the initial stage of
t
= 10 min, respectively. As
expected, the stiffness continues to increase, suggesting the
sample is strengthened during the process of aging. In addition,
the increase is greater in G
hv
than in G
hh
.
Figure 3. The experimental results of shear modulus changes versus
time during three days of aging at
σ
v
= 197.21 kPa.
Fig. 4 shows the probability distributions of measured,
normalized contact forces (in the vertical direction, F
z
) by the
tactile pressure sensor before and after three days of aging under
v
= 197.21 kPa. It can be readily seen that the contact forces
are redistributed after three days of aging.
Figure 4 Experimental results of the probability distributions of
normalized contact forces at
σ
v
= 197.21 kPa (a) before and (b) after
aging.
In order to further discuss such behavior, the contact forces
are categorized into two groups, i.e., strong and weak forces.
The categorization of strong and weak forces (i.e., the contact
normal forces at strong and weak contacts or at strong and weak
I-Scan software
Handle
Tactile pressure sensor
(b)
0
1
2
3
4
5
-5
0
5
10
Fz/<Fz>
P[Fz/<Fz>] (%)
P[Fz/<Fz>] (%)
(a)
0
1
2
3
4
5
-5
0
5
10
Fz/<Fz>
P[Fz/<Fz>] (%)
Weak
forces
Strong
forces
Loading
Tactile pressure sensor
Bender element sets installed
inside the sample
G
h
G
h
0
1
2
3
4
5
0
20
40
60
80
Time (hr)
Shear modulus change (%)
1
Ghh
Ghv
hv
hh
( )


