1911
Technical Committee 206 /
Comité technique 206
networks) follows the suggestion of Radjai et al. (1996). When
the normal contact force
F
n
is greater than its mean
n
F
(i.e.,
1
/
n
n
F F
), it is regarded as
a “
strong
”
force; otherwise it is a
“
weak
”
force. Also found in Fig. 4 is that the probability
distributions of weak forces decrease after aging. That is, the
force redistribution leads to increasing contact normal forces in
the weak force network such that some of the contact normal
forces that originally belong to weak ones can be changed to the
group of strong forces. In addition, the force distribution
becomes more homogenized after aging because the associated
coefficient of variation (CV) in F
z
reduces from 0.726 to 0.705.
Since the weak forces become fewer and the contact forces
become more homogenized in the sample, the soil structure is
strengthened and so is the associated G
hv
. A comprehensive data
set and more detailed explanations with the aid of DEM
simulations can be found in Gao (2012) and Gao and Wang
(2013).
3 USING THE 3D MEMS ACCELEROMETER FOR THE
STUDY OF LANDSLIDE INITIATION PROCESS
Micro-Electro-Mechanical-Systems (MEMS) is a classification
of devices, as well as the means of fabrication and
manufacturing. In 1959, Richard Feynman took the helm of
describing the "problem of manipulating and controlling things
on a small scale" and thence pioneers like Analog Devices have
since miniaturized conventional sensors from the size of a
closed fist to that of a quarter of fingernail (Feynman 1959).
The MEMS technology allows for batch-wise etching
production, thereby minimizing manufacturing cost and at the
same time promising standard accuracy and quality across
sensors. Up until the recent 5 years only does stabile 3-
dimensional MEMS accelerometer become available in the
market. The ADXL335 accelerometer model by Analog
Devices is selected for the second study to characterize
localized soil responses prior to and during landslide initiation.
The
Analog Devices’
ADXL335 is a miniature
accelerometer which measures 4 × 4 × 1.45
mm
(Length ×
Width × Thickness) in size and comes at a low price, about
couple US dollars per piece. It utilizes low power, typically
functioning at 3.0
V
and 350
μA
. The accelerometer is capable
of 3-axis sensing and measures full-scale acceleration within
±3.6
g
with a frequency bandwidth ranging from 0.5 to 1600
Hz
for the X and Y axes, and a range of 0.5 to 550
Hz
for the Z axis.
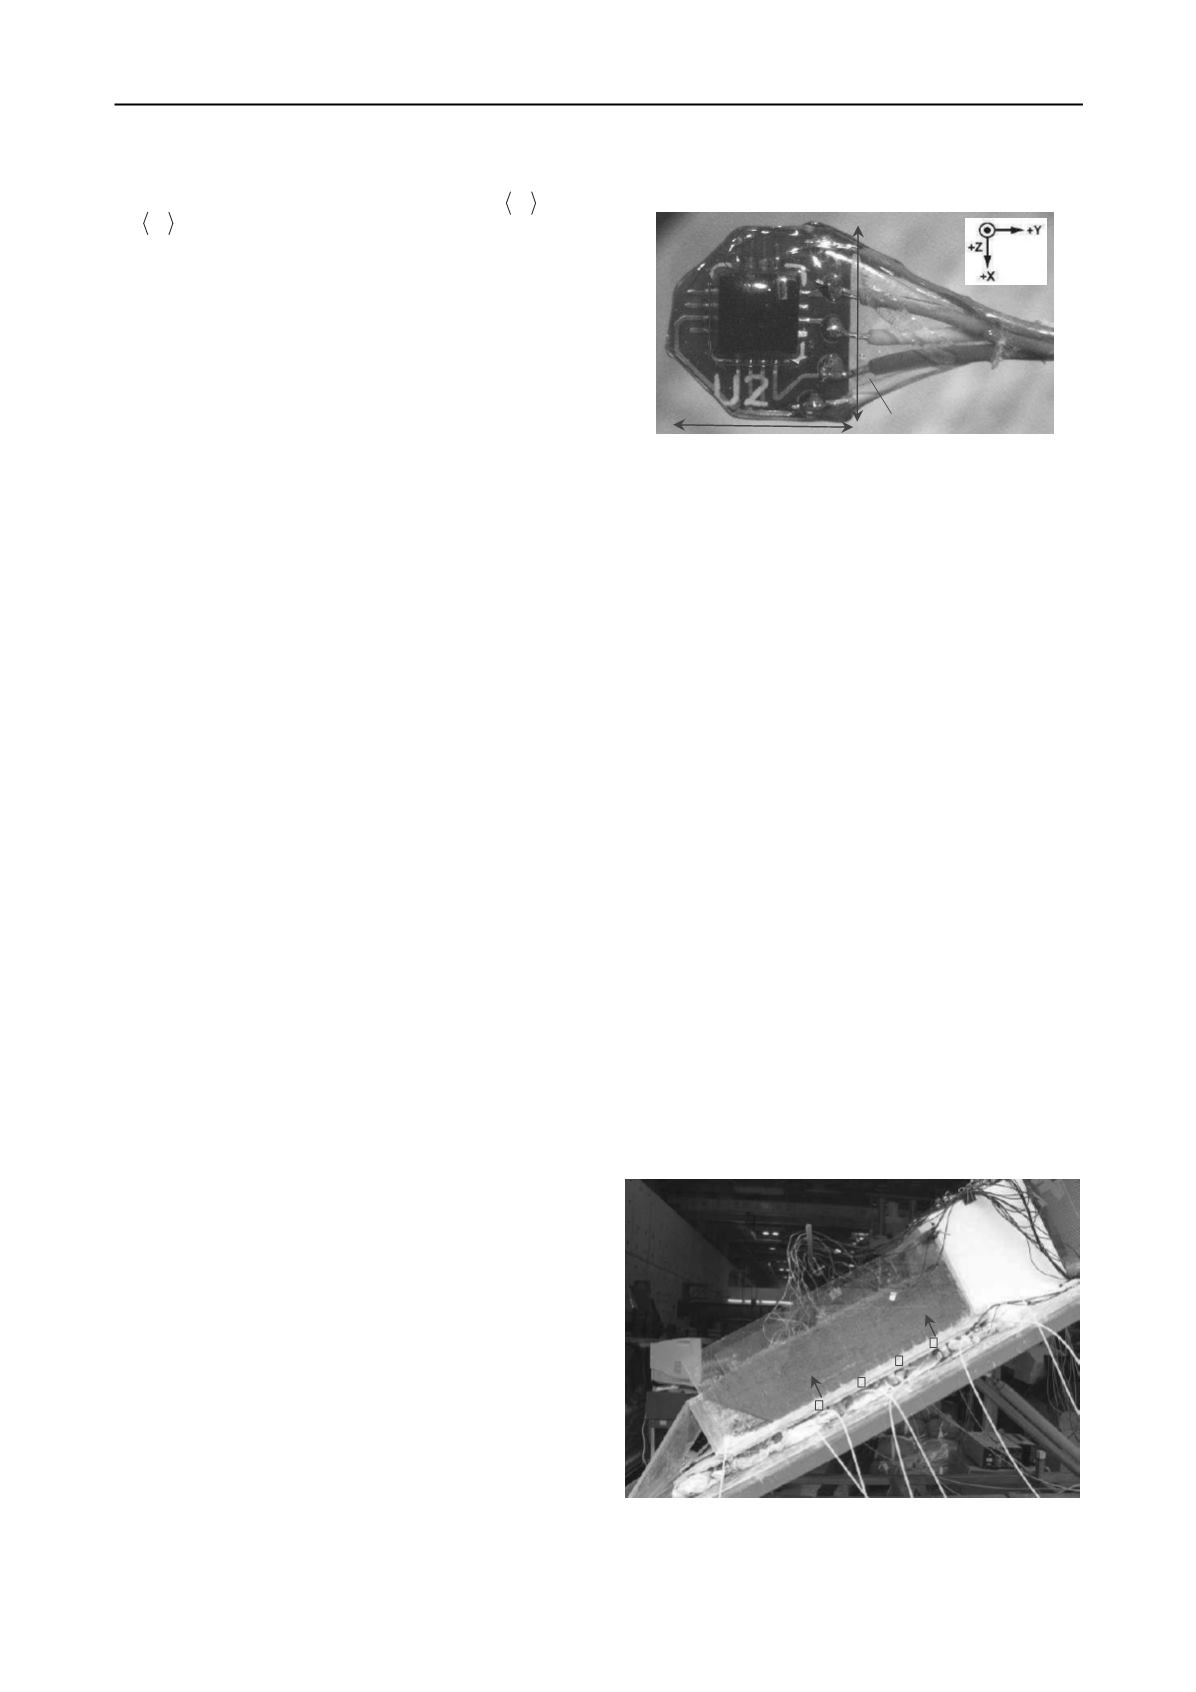
Fig. 5 illustrates the ADXL335 surface mounted on an in-house
designed printed circuit board (PCB) since soldering by hand is
impossible for the tiny pins; the PCB is 11 × 11 × 2
mm
(Length
× Width × Thickness) in size and the circuitry directs the
corresponding pins to larger soldering points. The package was
coated with several layers of air-dry polyurethane for
waterproof. Also shown in Fig. 5 are the positive directions of
X, Y and Z axes. The MEMS accelerometer is attractive not just
because of its light-weight, miniature size, low-cost and
standardized quality; it also boasts of the unique features of
measuring the static acceleration of gravity in tilt-sensing
applications, as well as dynamic acceleration resulting from
motion, shock or vibration.
These unique features provide us with two kinds of
information coming in one package. The DC bias offset in
signal conditioned voltage output gives us the tilt angle in
reference to the gravity. When the accelerometer is static, we
can calculate the current angles of tilt in three dimensions about
the accelerometer’s cen
ter of mass, known as roll, pitch and
yaw; when it is in motion, we can calculate the direction of
movement by finding the vector sum of the acceleration. In total
10 MEMS accelerometers were installed in both vertical and
horizontal array so that dilative or contractive behavior between
layers of soil could also be identified.
Figure 5. Analog Devices’ ADXL335 surface mounted on PCB.
3.1 Calibration of 3D MEMS Accelerometer
All the MEMS accelerometers were connected to a logging
computer through National Instruments’ NI
-USB 6353 analog-
to-digital converter with 16-bit resolution. Sampling frequency
of every axis was set at 10,000 Hz. Due to batch-wise
production, factory performance results of Analog Devices’
ADXL335 are compiled from 1000 pieces to determine the
mean bias offset value (Analog Devices 2010); however, to
further verify whether the sensors we purchased fall within the
range as documented, simple calibration using an earthquake
shaking table and a high-frequency vibration exciter was carried
out. The mean zero bias offset value for X-axis was found to
peak at 1.51 V, and for Y and Z axes the value was 1.49 V; all
sensors are functioning as detailed in the datasheet. The sensors
were also left operating overnight to check for possible noise
drift over time. Nothing anomalous happened and the sensors
performed normally as documented in the manual. Subsequent
conversions from voltage to acceleration which required
parameters from the datasheet were cited directly thereafter.
3.2 Laboratory Water Flume
Fig. 6 presents a side view of the well-instrumented laboratory
water flume. The rectangular soil prism made of acrylic is of
size 100 × 45.2 × 20 cm (Length × Width × Height). A
saturation box was affixed at the back to provide standardized
antecedent condition before each experiment. In addition to the
MEMS accelerometer array (for the positions of accelerometer
M1 to M10 see Fig. 6), basal porewater pressure transducers
were also installed as indicated by the little squares; a video
camera was shooting the process from the top. A layer of
bottom porous stone was affixed to the flume rack to provide
similar friction angle as the soil specimen at the bottom
boundary.
Figure 6. Laboratory water flume setup.
Polyurethane Coating
In-house PCB
ADXL335
4
mm
11
mm
M1
M2
M3
M4
M5
M6
M7
M8
M10
M9
Saturation Box
T1
T2


