1904
Proceedings of the 18t
h
International Conference on Soil Mechanics and Geotechnical Engineering, Paris 2013
- 5
0
5
10
0.0
- 0.1
- 0.2
- 0.3
- 0.4
- 0.5
R10
Interpreted shear strain
(%)
Elapsed time
t
e
(min)
MPS1
MPS2
R05
- 5
0
5
10
0.0
- 0.1
- 0.2
- 0.3
- 0.4
- 0.5
First
Failure
Second
failure
Second
failure
First
Failure
Elapsed time
t
e
(min)
MPS3
MPS4
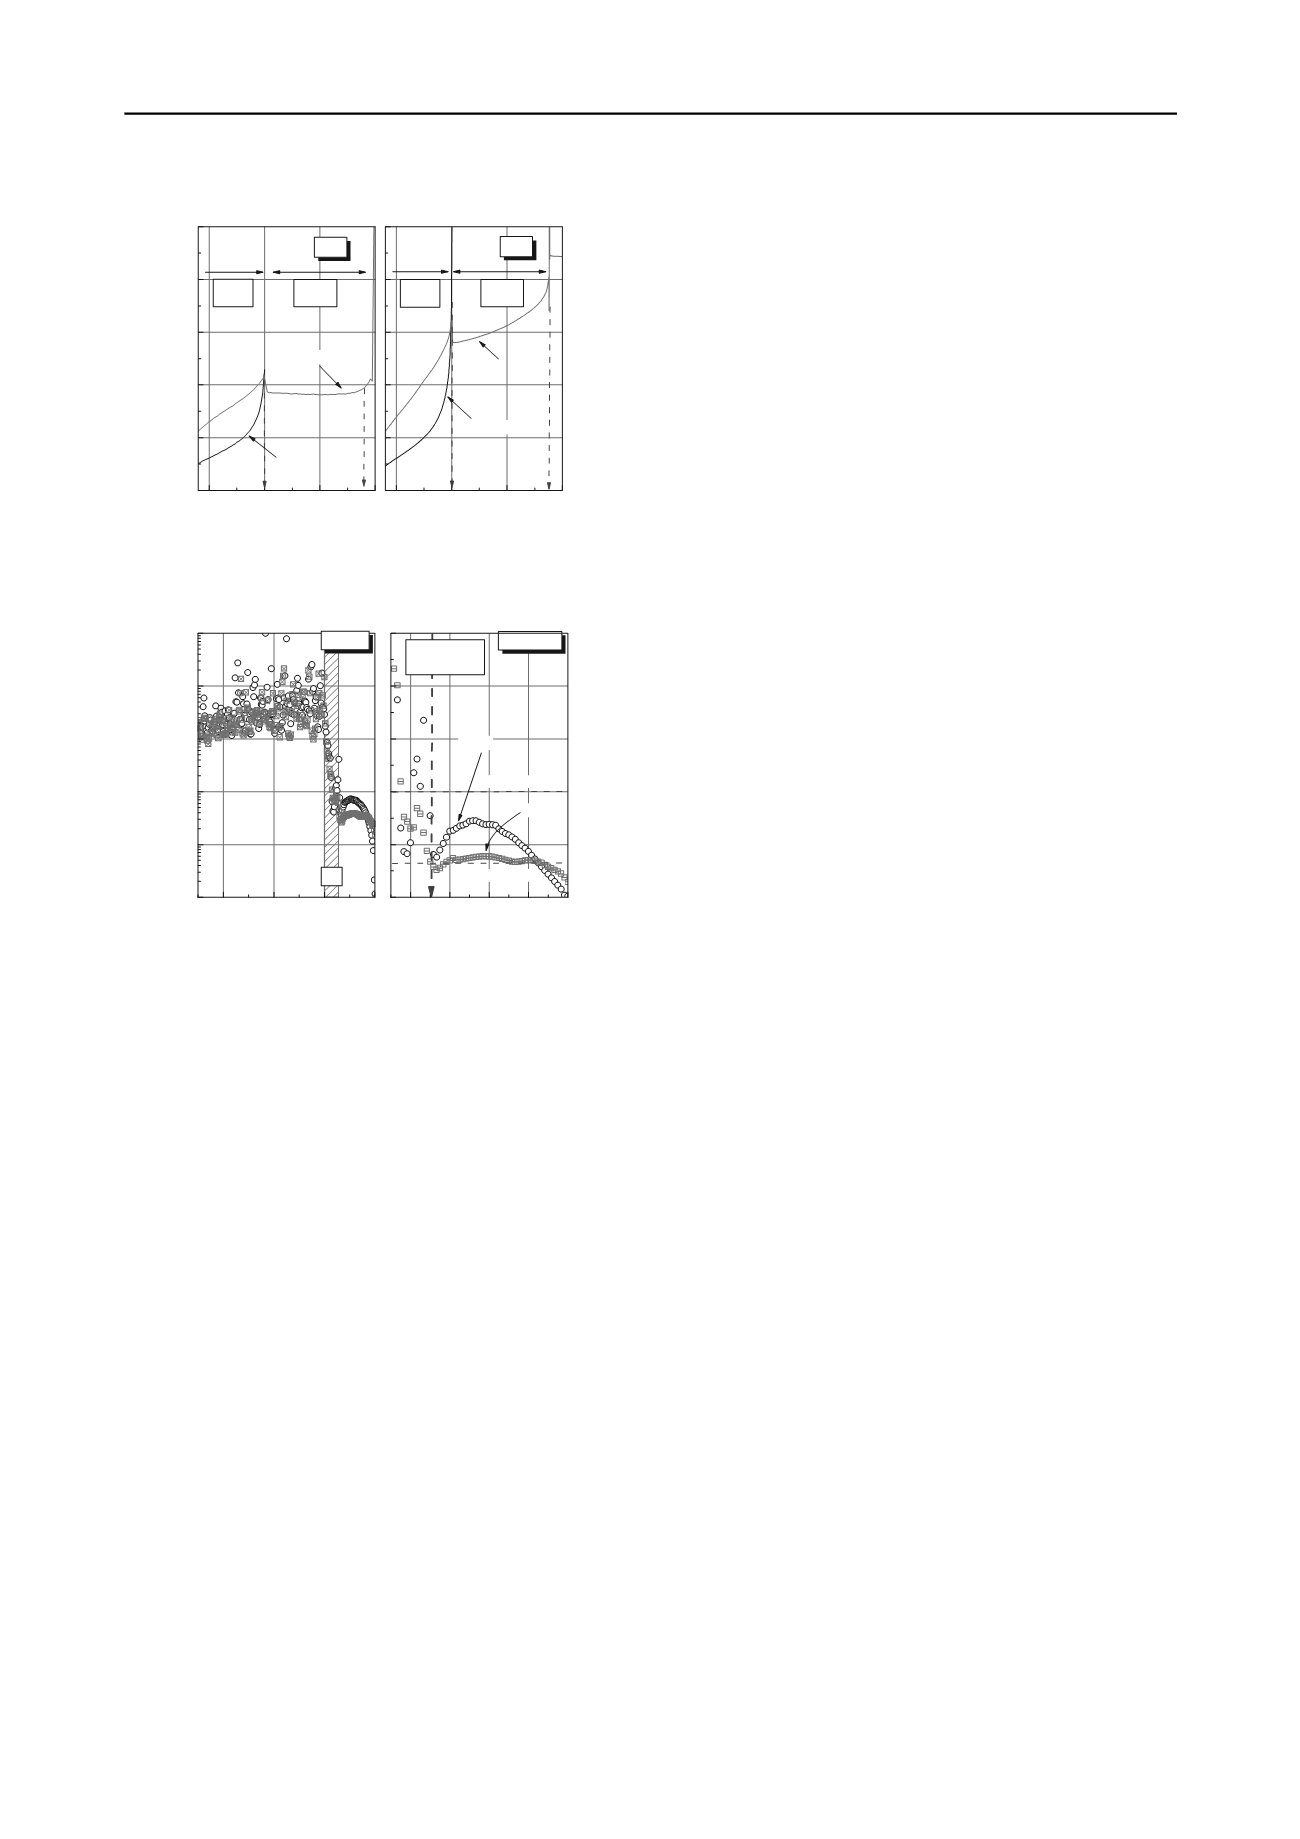
Figure 9. Increases of shear strain in the shallow section prior to the first
failure and the second failure
- 30
- 20
- 10
0
1
10
100
1000
10000
100000
S7
Inverse velocity of shear strain 1/
v
(min/ %)
Elapsed time
t
e
(min)
Completion
of S7
Overall
Expanded
- 8 - 6 - 4 - 2
0
0
50
100
150
200
250
v
=0.03 (%/ min)
MPS4
Elapsed time
t
e
(min)
MPS3
v
=0.01 (%/ min)
Figure 10. Decrease of the inverse velocity of shear strain prior to the
first failure (Overall view in left and expanded view in right)
In addition, a displacement
d
increased in DTP1 installed at
the lower side of slope in advance, and its value showed the step
increase from S5 and S6. Same phenomena in the increase can
be seen in both sets of DTP and MPS. Meanwhile, curves on
angle of inclination
a
did not show clear reactions
corresponding to the series of cuttings. A value of ASG1 was
kept stable while a value of ASG2 gradual increase from S3.
There was no clear reaction on
a
excluding those at the moment
of the second failure while the slope was getting unstable.
Figure 8 shows the relationship between
and
d
in addition
to the relationship between
a
and
d
.
shows a clear increase
prior to the first failure when
d
hovered between 4 and 7.
also
reacted to the second failure so that
still increased where
d
>7.
Meanwhile, values of
a
increased very little from -0.4 to -0.8
deg to the
d
though -0.4 deg of the initial drift appeared.
5.2
Increment of the shear strain in the shallow section prior
to failure
Figure 9 shows the relationship between
and an elapsed time
t
e
recorded by 4 sets of MPS. Both MPS1 and MPS2 were
installed in the column of R05 whereas MPS3 and MPS4 were
installed in the R10 as shown in Figure 3.
t
e
is a modified value
that is calculated as zero at the beginning of the first failure.
Accordingly, negative values mean the remaining time until the
first failure. Recorded data by both lower MPS1 and MPS3
ended at 0 of
t
e
because these dropped together with collapsed
soil at the first failure. Upper MPS 2 and MPS4 had recorded
data until the second failure. Four curves commonly show a
linear increase at around -5 of
t
e
, and this phenomena was
similar to the 2
nd
creep that was well known as the plastic
deformation prior to failures. In addition, the value of both
MPS1 and MPS3 installed inside of the failure block
accelerated these increases from -3 of
t
e
. Same acceleration on
the increase was seen in the values of both MPS2 and MPS4
before the second failure.
The left side figure on Figure 10 shows the entire relationship
between the inverse velocity of the shear strain 1/
v
and
t
e
by a
logarithmic scale on a vertical axis.
v
is defined as a value of
the increment of
per minute. 1/
v
of both MPS1 and MPS3
were distributed at higher values from 1,000 and 30,000, when
t
e
was between -35 and -10. This means at least that little
v
appeared 10 minutes before the first failure. However, 1/
v
shows the drastic decrease corresponding to the beginning of
the final cutting of S7. However, the slope did not fail soon. A
couple minutes of time lag existed prior to both failures, and
this causes people’s misunderstanding of the stability.
The right side figure shows an expanded view by a linear
scale on a vertical axis. 1/
v
indicated the values between 30 and
80 min/% while 4 minutes between -7 and -3 of
t
e
, Accordingly,
the values of
v
were interpreted as between 0.01 and
0.03 %/min. Consequently, the shear strain increased at mostly
constant rate in the same manner as the 2
nd
creep. Moreover,
1/
v
in MPS1 and MPS3 linearly decreased from -2 and -4 of
t
e
,
respectively. This proves that values of
were accelerating
these increases just before failures, the same as the 3
rd
creep.
Accordingly, a clear increase of shear strain in the shallow
section of the slope was confirmed in the large scale model test.
In addition, it was proven that this phenomenon reflects an
increase of potential risk of slope failure. Therefore, a couple of
minutes could be provided for escape by identifying either the
2
nd
creep or the 3
rd
creep.
6 CONCLUSIONS
A large scale model test was carried out in this study to
investigate relationship between the potential risk of slope
failure and an increase of the shear strain in the shallow section.
Developed compact shear strain meters as well as conventional
sensors of inclinometers and extensometers were used in the test
to measure the movement of the slope prior to failure. Seven
steps of cuttings were performed in the toe to make unstable.
The model slope did not fail soon after a completion of the final
cutting, and around 7 minutes of the time lag existed until the
beginning of failure. Clear increases in the responses of shear
strains
in the shallow section were measured with the progress
of the cuttings. The obtained data of
and the displacement
d
showed good agreement in their reactions. Accordingly, it is
proven that the potential risk of slope failure was detectable by
monitoring of the shear strain in the shallow section for
simplicity.
7 ACKNOWLEDGEMENTS
The authors would like to thank Prof. Toshiyuki Kadada, Mr.
Nozomu Yamamoto of Tokyo City University, Dr. Kazuya Itoh
and Dr. Naotaka Kikkawa of the National Institute of
Occupational Safety and Health, Japan for their cooperation in
the large scale model test and analyses.
8 REFERENCES
Itoh, K., Toyosawa, Y., Tamrakar, S. B. & Horii, N. 2005. Analysis of
labor accidents caused by slope failure. Landslide,
Journal of the
Japan Landslide Society
, 41(6), 585-597.
Tamate, S. and Itoh, K. 2009.Monitoring of shear strain in shallow
sections of slopes to detect increased risk of slope failure.
Proceedings of the 17
th
International Conference on Soil Mechanics
and Geotechnical Engineering
, 2143-2146.
Tamate, S. 2010. Penetration-type pipe strain gauge,
United States
Patent
, No.7,762,143 B2, Jul.27.2010.


