 
          1265
        
        
          Technical Committee 202 /


            Comité technique 202


            Proceedings of the 18


            th


            International Conference on Soil Mechanics and Geotechnical Engineering, Paris 2013


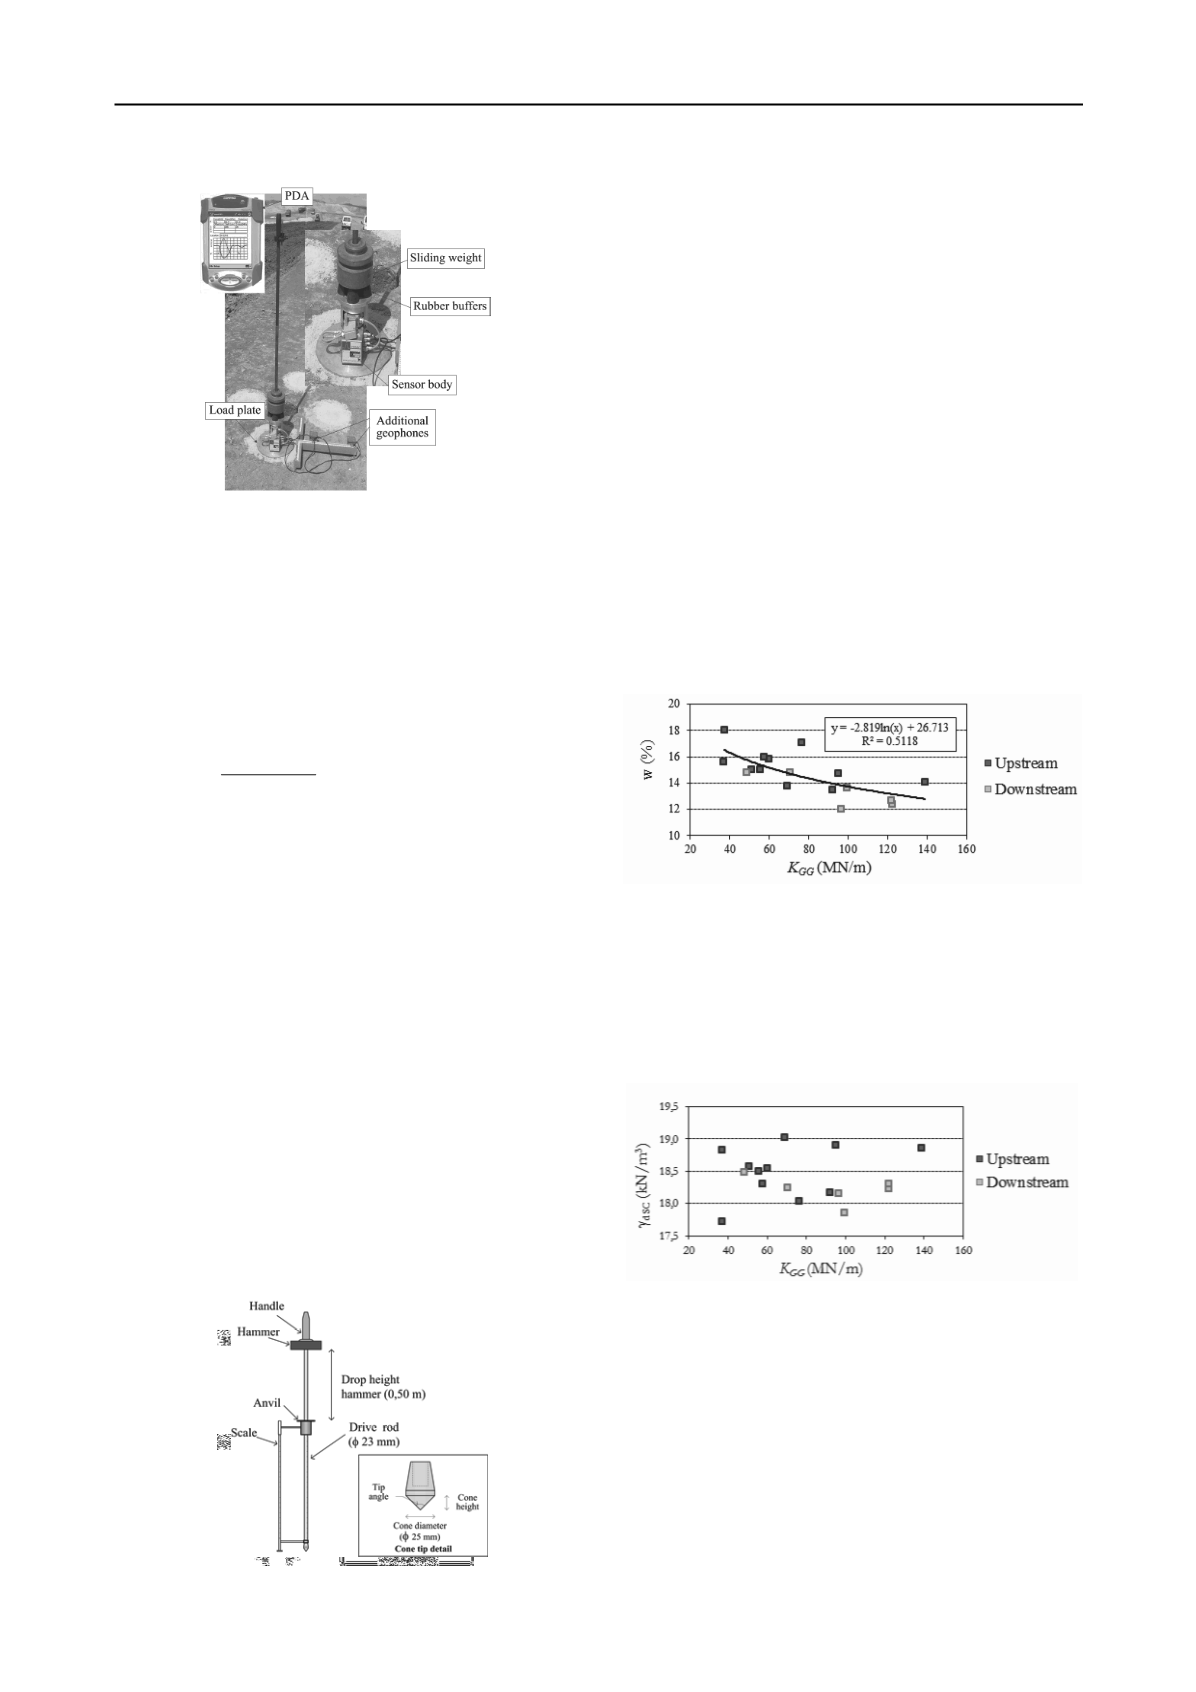
          Figure 6. Prima 100 P-FWD device.
        
        
          The device measures both force and deflection. The software
        
        
          enables the selection of test setup and to visualize and save the
        
        
          test results. Time histories and peak values of load and
        
        
          deflection are displayed in a hand-held computer (PDA). The
        
        
          peak values of load and deflection allow determining the elastic
        
        
          stiffness modulus,


            E


            P-FWD


          . The equation used to determine


            E


            P-FWD


          is based on the Boussinesq’s equation. It corresponds to
        
        
          calculating the surface modulus of a layered material under a
        
        
          uniform circular load of radius R, assuming an uniform
        
        
          Poisson’s ratio:


            c


            FWD P


            R


            f


            E


          2
        
        
          1


          (2)
        
        
          where


            f


          is the stress distribution factor, assumed 2.0 (flexible
        
        
          plate),
        
        
          ν
        
        
          is th
        
        
          e Poisson’s ratio, assumed 0.35
        
        
          ,


          is the (peak)
        
        
          impact stress under the loading plate (kPa),


            R


          is the P-FWD
        
        
          loading plate radius (150 mm) and
        
        
          δ


            c


          is the (1
        
        
          st
        
        
          peak) P-FWD
        
        
          deflection (


          m).
        
        
          Initially, a 300 mm diameter loading plate, four buffers, a 15
        
        
          kg falling mass and a 0.8 m drop height were adopted. This
        
        
          configuration proved to be inadequate due to the excessive
        
        
          energy involved which caused the apparatus to detach from the
        
        
          ground after impact. It was observed that this affected the
        
        
          accuracy of the deflection measurement. The experimental setup
        
        
          was then changed to a 10 kg falling mass and a 0.4 m drop
        
        
          height, which proved to be adequate in terms of contact and
        
        
          reading accuracy (Conde


            et al


          ., 2009). With this setup the
        
        
          equipment applies a contact pressure between 85 and 100 kPa.
        
        
          2.6


            DCP testing


          Dynamic cone penetrometer (DCP) allows a simple, fast, and
        
        
          economical usage and provides continuous measurement of the
        
        
          penetration resistance of embankment or pavement layers. The
        
        
          DCP consists of a steel rod with a cone tip at the end. In this
        
        
          study a light weight configuration was used, i.e. with a 10 kg
        
        
          hammer, with a falling height of 50 cm (Figure 7).
        
        
          Figure 7. DCP device.
        
        
          In this study DCP testing was performed according to
        
        
          EN ISO 22476-2 standard.
        
        
          The readings were taken
        
        
          continuously through the compaction layer depth, i.e. along 40
        
        
          cm, and recorded every 10 cm. Based on the total number of
        
        
          blows required to drive the penetrometer through the layer, the
        
        
          average penetration rate at each 10 cm penetration PN10
        
        
          (mm/blow) or the cumulative number of blows N
        
        
          10
        
        
          were was
        
        
          calculated.
        
        
          3 RESULTS ANALYSIS
        
        
          To evaluate the performance of these devices as tools for the
        
        
          compaction control of embankment layer, the sensitivity of the
        
        
          results to variations in water content and in dry density of
        
        
          geomaterials determined by traditional methods was assessed.
        
        
          3.1


            K


            GG


            results


          Figure 8 shows the correlation between water content (w) and


            K


            GG


          . The chart shows some scattering about the adjusted
        
        
          negative exponential trend which limits the quality of the
        
        
          adjustement. A significant increase of the geogauge stiffness
        
        
          with decreasing water content may be inferred from the data
        
        
          both in the upstream and in the downstream shells.
        
        
          Figure 8. Relation between soil stiffness, k
        
        
          GG
        
        
          , and water content, w.
        
        
          Regarding the dependence of


            K


            GG


          on the


            in situ


          dry density,
        
        
          the results in Table 2 present minor variations of the relative
        
        
          compaction, i.e. of


            d SC


            ,


          thus making the correlation analysis
        
        
          dificult. Conde


            et al


          . (2010) analyzed these results concluding
        
        
          that small and erratic sensitivity of stiffness values determined
        
        
          by geogauge occurred with only relatively small variations in
        
        
          dry density (Figure 9).
        
        
          Figure 9. Soil stiffness,


            k


            GG


          , and dry density,


          d SC
        
        
          , results.
        
        
          The joint consideration of both results seems to indicate that
        
        
          soil stiffness is only a reliable predictor of the water content
        
        
          variation. This sensitivity of stiffness to changes in water
        
        
          content were also observed by Abu-Farsakh


            et al.


          (2004) in a
        
        
          study conducted on fine soils (silt, sandy clay and clay).
        
        
          3.2


            E


            P-FWD


            results


          Figure 10 shows the relationship between the elastic stiffness
        
        
          modulus (


            E


            P-FWD


          ) and the


            in situ


          water content (w). While the
        
        
          adjusted trend is again of the negative exponential type, a
        
        
          smaller scatter is now observed in comparison with that of the
        
        
          geogauge results.
        
        
          100 P-FWD device.
        
        
          measures both force and deflection. The software enables the selection of test setup and to visualize and save
        
        
          s. Time histories and peak values of load and deflection are displayed in a hand-held computer (PDA). The peak
        
        
          and deflection allow determining the elastic stiffness modulus,


            E


            P-FWD


          . The equation used to determine


            E


            P-FWD


          he Boussinesq’s equation. It corresponds to calculating the surface modulus of a lay red m terial under a
        
        
          lar load of radius R, assuming an uniform Poisson’s ratio:


            c


            R


            f


          2
        
        
          1


          (1)
        
        
          stress distribution factor, assumed 2.0 (flexible plate),


            ν


          is the Poisson’s ratio, assumed 0.35,


          is the (peak)
        
        
          under the loading plate (kPa),


            R


          is the P-FWD loading plate radius (150 mm) and


            δ


            c


          is the (1
        
        
          st
        
        
          peak) P-FWD
        
        
          ).
        
        
          300 mm diameter loading plate, four buffers, a 15 kg falling mass and a 0.8 m drop height were adopted. This
        
        
          proved to be inadequate due to the excessive energy involved which caused the apparatus to detach from the
        
        
          mpact. It was observed that this affected the accuracy of the deflection measurement. The experimental setup
        
        
          nged to a 10 kg falling mass and a 0.4 m drop height, which proved to be adequate in terms of contact and
        
        
          acy (Conde


            et al


          ., 2009). With this setup the equipment applies a contact pressure between 85 and 100 kPa.


            sting


          e penetrometer (DCP) allows a simple, fast, and economical usage and provides continuous measurement of the
        
        
          sistance of embankment or pavement layers. The DCP consists of a steel rod with a cone tip at the end. In this
        
        
          eight configuration was used, i.e. with a 10 kg hammer, with a falling height of 50 cm (Figure 2).
        
        
          device.
        
        
          dy DCP testing was performed according to EN ISO 22476-2 standard. The readings were taken continuously
        
        
          mpaction layer depth, i.e. along 40 cm, and recorded every 10 cm. Based on the total number of blows required
        
        
          enetrometer through the layer, the average penetration rate at each 10 cm penetration PN10 (mm/blow) or the
        
        
          mber of blows N
        
        
          10
        
        
          were was calculated.