1260
Proceedings of the 18
th
International Conference on Soil Mechanics and Geotechnical Engineering, Paris 2013
Figure. 3 Longitudinal view of the embankment.
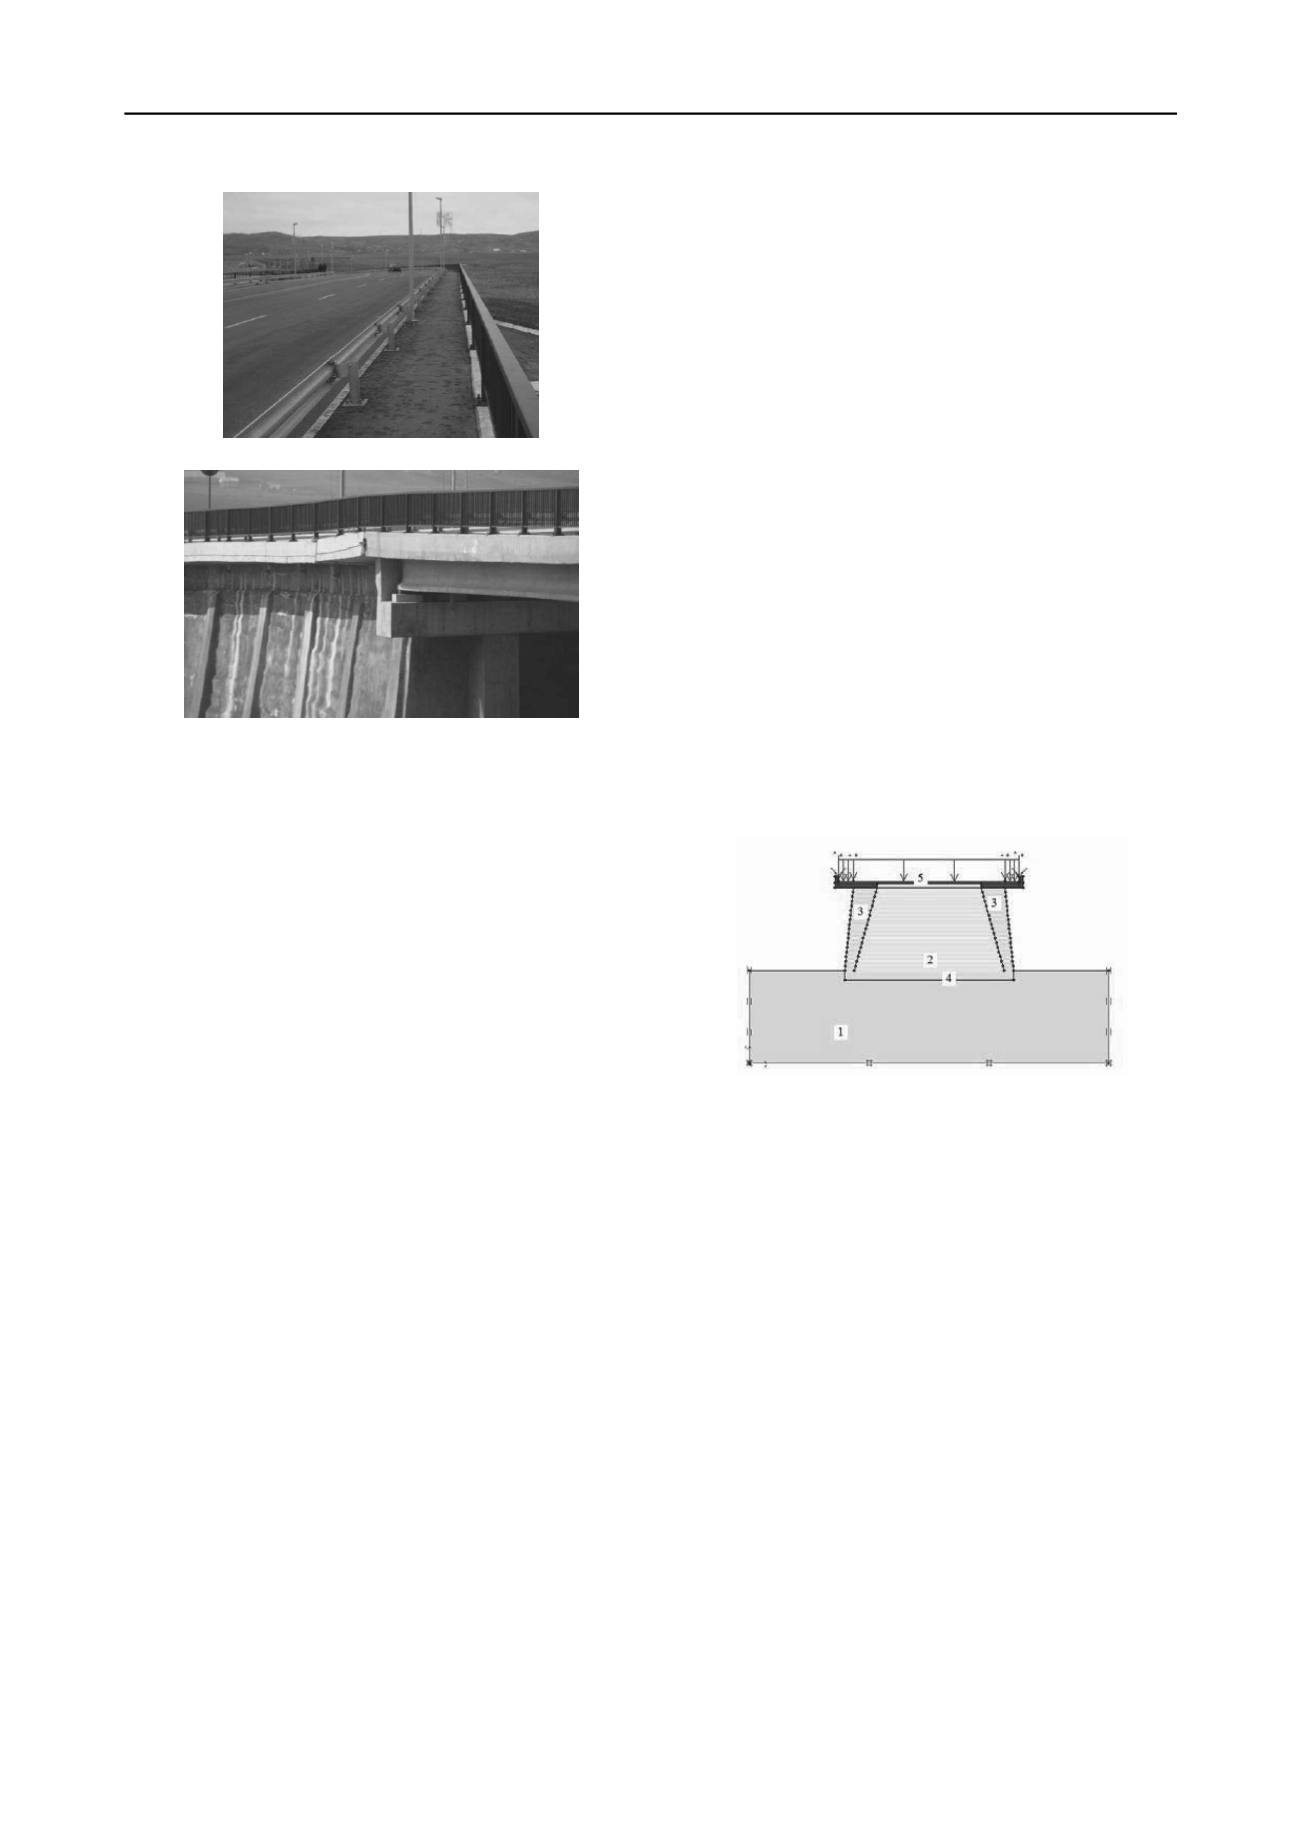
Figure 4 Zone between embankment - bridge.
2 GEOTECHNICAL INVESTIGATIONS
Geotechnical studies show the followings:
- the lithology of soil is: vegetable soil 0,5m, black/yellow
plastic clay for up to 5,00m (Bahlui clay), saturated sand,
saturated sand with gravel (5-7m) and marl clay from 12m;
- underground water from 2-4m from terrain level, this level
can be ascensional with 0,8m;
- peak ground acceleration a
g
=0,2g, Tc=1sec (P100-2006);
- Bahlui clay is very active, with high compressibility and big
variations of volume (shrinkage-belly);
- plasticity index I
p
= (30÷45)%;
- saturation degree S
r
= 0.80÷0.90;
- oedometric modulus M
2-3
= 4.000÷10.000 kPa;
- modulus of linear deformation E
50.00kPa;
- dry volumic weight γ
d
= 14.8÷15.5kN/m
3
;
- natural volumic weight γ = 18.75÷19kN/m3;
- porosity n = (40÷45)%;
- void ratio e = 0.838;
- angle of internal friction Ø = 12
⁰
÷16
⁰
;
- cohesion c = (15÷25)kPa.
For construction supervision of soil works have been made
the following tests: (a) tests in open system (CK
0
D), for which
the specimens during shearing until breaking have been in
contact with water from the beginning, soil being free to change
his humidity with the raising the intensity of shearing force, (b)
tests in closed system (CK
0
D-A), for which the specimens
during shearing untill breaking have been in natural state
humidity without any contact with a free source of water.
For both type of tests the specimens are consolidated under
stress states coresponding to “K
0
line”, after which they are
sheared as presented above.
We can observe that on both loading systems, in the zone of
normal stresses σ' < 0,8 daN/cm
2
intrinsec curve has big values
for angle of internal friction and low values for cohesion and in
the zone of normal stresses σ' > 0,8 daN/cm
2
situation is
reversed. Also it can be seen that for closed system of testing
intrinsec curve near the origin of axis Bahlui clay has values 4
times bigger for apparent cohesion c', and in the zone of normal
stresses σ' > 0,8 daN/cm
2
presents values a little bigger for
apparent angle of internal friction
'.
From tests we have seen that, invariable, the specific volume
deformation of specimens tested in open system, correspond to
a reduction of void ratio through shearing and for specimens
tested in closed system specific volume deformation correspond
to a mechanical growing – dilatancy who appears in a specified
point in load path function of latteral pressure σ
3
. Also it is
important to note that dilatancy appears when deviatoric stresses
q is in direct raport with spherical stress p and volume variation
depends of q. This experimental observation has a great
practical importance because it shows the zones in wich
dilatancy occures funtion of the report between deviatoric stress
and spherical stress.
In conclusion, material properties for analysis are:
1. Bahlui clay:
a. Dry state:
γ=17kN/m
3,
Ø=23°, Cd=20kPa, E=15.000kPa, ν=0,30
b. Floded state:
γ=21kN/m
3
, Ø=25°, Cd=5kPa, E=5.000kPa, ν=0,35
2. Backfill for embakment:
γ=20kN/m
3
, Ø=20°, c=50kPa, E=18.000kPa, ν=0,30
3. Loose backfill:
γ=20kN/m
3
, Ø=20°, c=50kPa, E=10.000kPa, ν=0,30
4. Stone layer:
γ=20kN/m
3
, Ø=25°, c=1kPa, E=30.000kPa, ν=0,30
5. Asphalt:
γ=22kN/m
3
, E=20.000kPa, ν=0,20
Loads are:
‐
self weight,
‐
on road – 100kN/m
2
,
‐
on sidewalk – 10kN/m
2
.
Figure 5 General section with materials.
3 FINITE ELEMENT ANALYSIS
The analysis was made using PLAXIS software. Model was
plane strain with 15 node elements.
The analysis was made to predict future behavior of the
embankment. Different models were taken into consideration
taken into consideration the following:
‐
Foundation soil of embankment is almost every time
of the year flooded. Bahlui river is not flood
controlled in that area.
‐
Backfill was loose on the edges of the embankment
due to the lack of technology used in civil works (Fig.
4).
The 3 models taken into analysis are:
a) MODEL 1. Model with soils in natural state
b) MODEL 2. Model with foundation soil in flooded state
c) MODEL 3. Seismic response due to earthquake with
foundation soil in flooded state
a) MODEL 1. Model with soils in natural state.
This model is the simplest model taken into consideration.
This means that the properties of materials are in natural state.


