1264
Proceedings of the 18
th
International Conference on Soil Mechanics and Geotechnical Engineering, Paris 2013
Proceedings of the 18
th
International Conference on Soil Mechanics and Geotechnical Engineering, Paris 2013
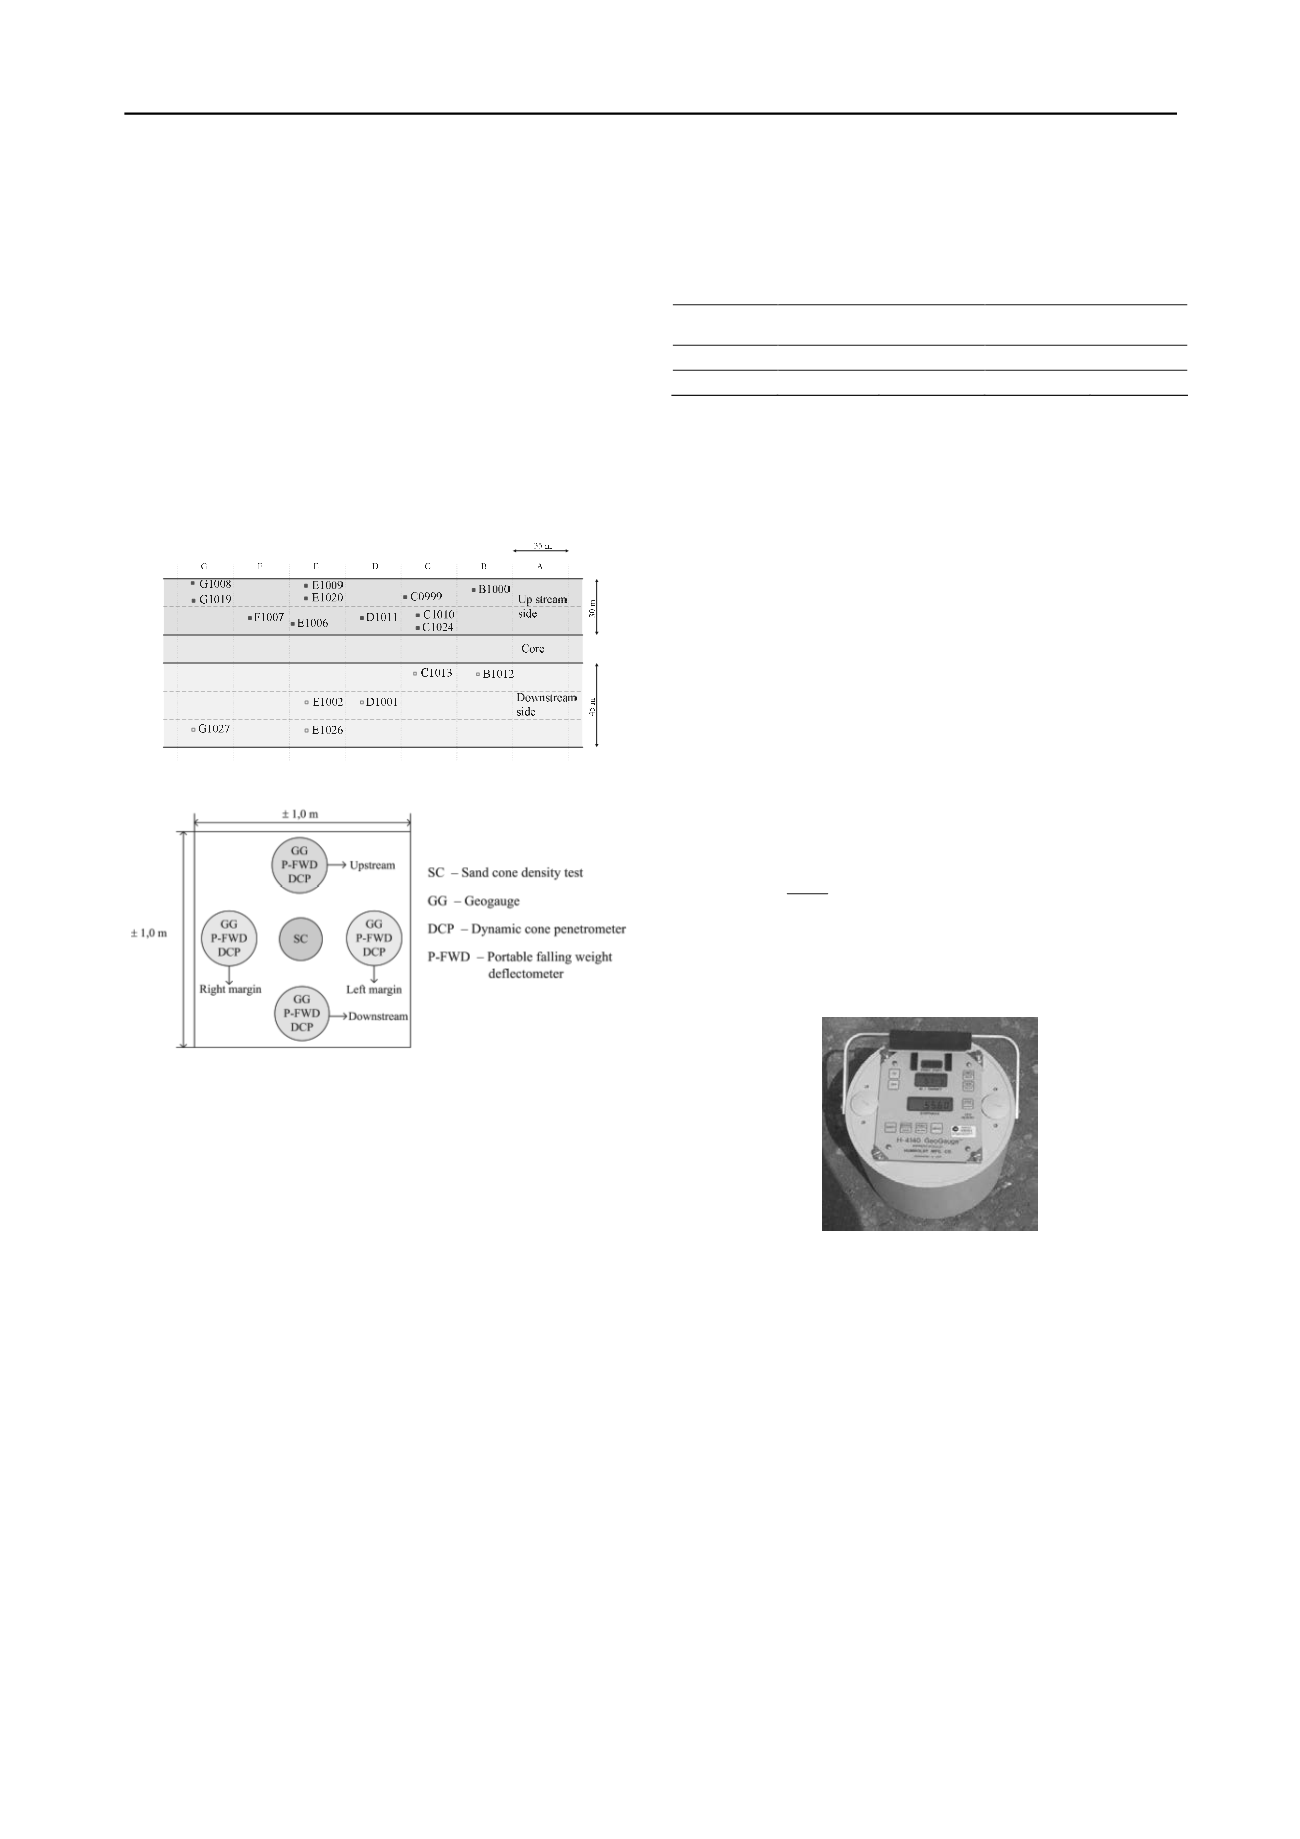
2.2
Experimental layout
In Figure 3 the field tests performed at the different locations
within 35 m wide bands, from A to G, are summarized. The
layout of the field tests carried out at each position is illustrated
in Figure 4. A cross-shaped configuration was selected with the
traditional tests at the center and the performance base methods
at the cross ends. The sand cone density test was used to
measure in-place unit weight, according to ASTM D 1556
standard. Soil samples were also collected from each test
position for water content (w) determination in the laboratory
by the microwave oven heating procedure, following ASTM D
4643 standard. Measurements with geogauge and P-FWD were
taken at surface. The DCP readings were taken continuously
along the compaction layer depth, i.e. 40 cm, and recorded
every 10 cm.
Figure 3. Plan view of the test positions.
Figure 4. Tests arrangement at each test position.
In order to limit the disturbance caused by each type of test
on the results, the following sequence of tests was selected:
geogauge, P-FWD and DCP.
2.3
Compaction control
The required properties of the compacted fill layers were
established during the construction of a trial embankment.
Accordingly, the layers of the shells were compacted to 40 cm
thickness by eight passes of a smooth steel drum vibratory
roller, model CAT 583. A minimum relative compaction of
95% to the reference standard Proctor was required for
compaction approval. Further, regarding maximum water
content deviation to optimum water content (owc) up to + 2% at
the upstream shell and between
–
2% to + 1% at the
downstream shell was required.
The soils used in the dam construction came from borrow
areas; therefore some degree of heterogeneity in their physical
and mechanical properties was anticipated. The compaction
control in heterogeneous materials, based on dry density and
water content determination at each controlled point would
involve a volume of work and delay in the results presentation,
with potential interference with the construction schedule. Thus,
the Hilf method was selected for control of compaction work
(ASTM D 5080). It allows the determination of the relative
compaction, RC, and the water content deviation from owc,
w,
based uniquely on the soil density value, thus without water
content measurement and previous knowledge of the Proctor
reference curve. Table 2 shows the range of results of the
compaction control by the Hilf method in upstream and
downstream shells. As summarized in Table 2 the relative
compaction and water content deviation values lie within the
expected ranges.
Table 2. Range of compaction results control by the Hilf method.
Location
(kN/m
3
)
d max.
(kN/m
3
)
RC
(%)
w
(%)
Upstream 20.2 to 21.3 17.5 to 18.8 98.5 to 99.7 +0.1 to +1.7
Downstream 19.9 to 20.8 17.6 to 18.3 97.6 to 99.7 -0.7 to +0.7
2.4
Geogauge testing
The geogauge device testing procedure is based on the response
of a linear elastic medium to a dynamic force applied at the
surface. It allows the determination of the elastic Young
modulus of the near surface material. The geogauge is a
cylinder with a height of 270 mm and a diameter of 280 mm, as
shown in Figure 5. The equipment weighs approximately
100 N. The device rests on a circular ring placed and seated
firmly at the soil surface. The base cylinder has an outside
diameter of 114 mm and an inside diameter of 89 mm. The
geogauge shaker scans the frequency domain between 100 and
196 Hz with 4 Hz increments, totalizing 25 individual
frequencies (Alshibli
et al
., 2005). During the test sequence, the
small amplitude deflection
and the applied force F are
recorded, thus enabling the determination of the soil vertical
specific stiffness, the so-called geogauge stiffness (
K
GG
). The
average of the 25 stiffness values is taken as the representative
value of
K
GG
.
The elastic Young’s modulus (
E
GG
) of the soil is
then computed by the equation:
R .
ν
-
k E
GG GG
771
1
2
(1)
where
is the
Poisson’s rat
io and
R
is the radius of the
geogauge base (57.15 mm), being
E
GG
expressed in MPa and
K
GG
in MN/m.
Figure 5. Geogauge device.
2.5
P-FWD testing
The P-FWD device used was a Prima 100. It consists of four
major parts: the sensor body, load plate, buffer system and
sliding weight (Figure 6).
The sensor body encloses a load cell and a geophone. The
latter is spring mounted at the center of the load plate and
measures the deflection of the surface caused by the impact
load. The Prima 100 allows the user to vary the drop height,
weight, plate diameter and the number of rubber buffers.
The adjustment of the weight and drop height allows one to
adjust the impact energy. Additional drop weight increases the
stress exerted by the plate. By changing the size of the loading
plate diameter the stress imparted onto the sub-grade soil may
also be adjusted. The number of rubber buffers can be selected
to alter the duration of the load impact impulse.


