1269
Technical Committee 202 /
Comité technique 202
(diagonal) arch right in Figure 2 and the limit state of equation
(1). Note that this is different from figure 78 in BS8006, where
the crown element is the crown of the plane strain arch (but the
equations in BS8006 are correct and thus derived for the
diagonal arch). The soil weight below the arch is added to
calculate the pressure on the subsurface
v:GR
:
;
2
v GR
i
s a
(2)
It is supposed that the entire area between the piles is loaded by
this load
v;GR
. This load is thus assumed to be equally
distributed. The remaining load is assumed to be the pile load
(A). This pile load is calculated for both the crown and the foot
element. The minimum pile load of Acrown and Atoe is
considered to be normative.
r
i
=(s-a)/2
r
o
=s/2
s
a
Figure 5. Hewlett & Randolph (1988) detail of the ‘toe’ element
4 ZAESKE (1988)
De model of Zaeske (2001) exists of a set of scales. The crown
of each scale is thicker than the feet of the scales as indicated in
Figure 3. Only the diagonal of the arches is considered, and this
diagonal rests on the pile caps. Zaeske derived the vertical
(radial) stress
σ
z
in the central line between 4 piles by
considering the vertical (radial) equilibrium of the set of crown
elements of the arches, as indicated in Figure 3. He assumed
that:
The stress situation in the feet of the arches, thus just on top
of the pile cap, is in a nearly-plastic situation. Thus the
earth pressure coefficient is maximal:
K = K
p
(equation
(1)).
The total tangential force just above the top of the pile cap
equals the total tangential force along the vertical line of
crown elements. Thus the passive earth pressure coefficient
K
at the top of the arch is less than the
K
at the toe of the
arch, according to the ratio of the scale width at the toe and
the crown (
d
/
s
d
)
.
This way, Zaeske determined the radial stress in the crown
element of each scale and extended this downwards for the
entire vertical line through the crown elements. For
z=0
, he
finally obtained the value for the vertical pressure on the GR in
the mid of 4 piles (
σ
z0
= σ
z
(z=o)).
Zaeske assumes that this
pressure
σ
zo
is constant for the entire GR area between the piles.
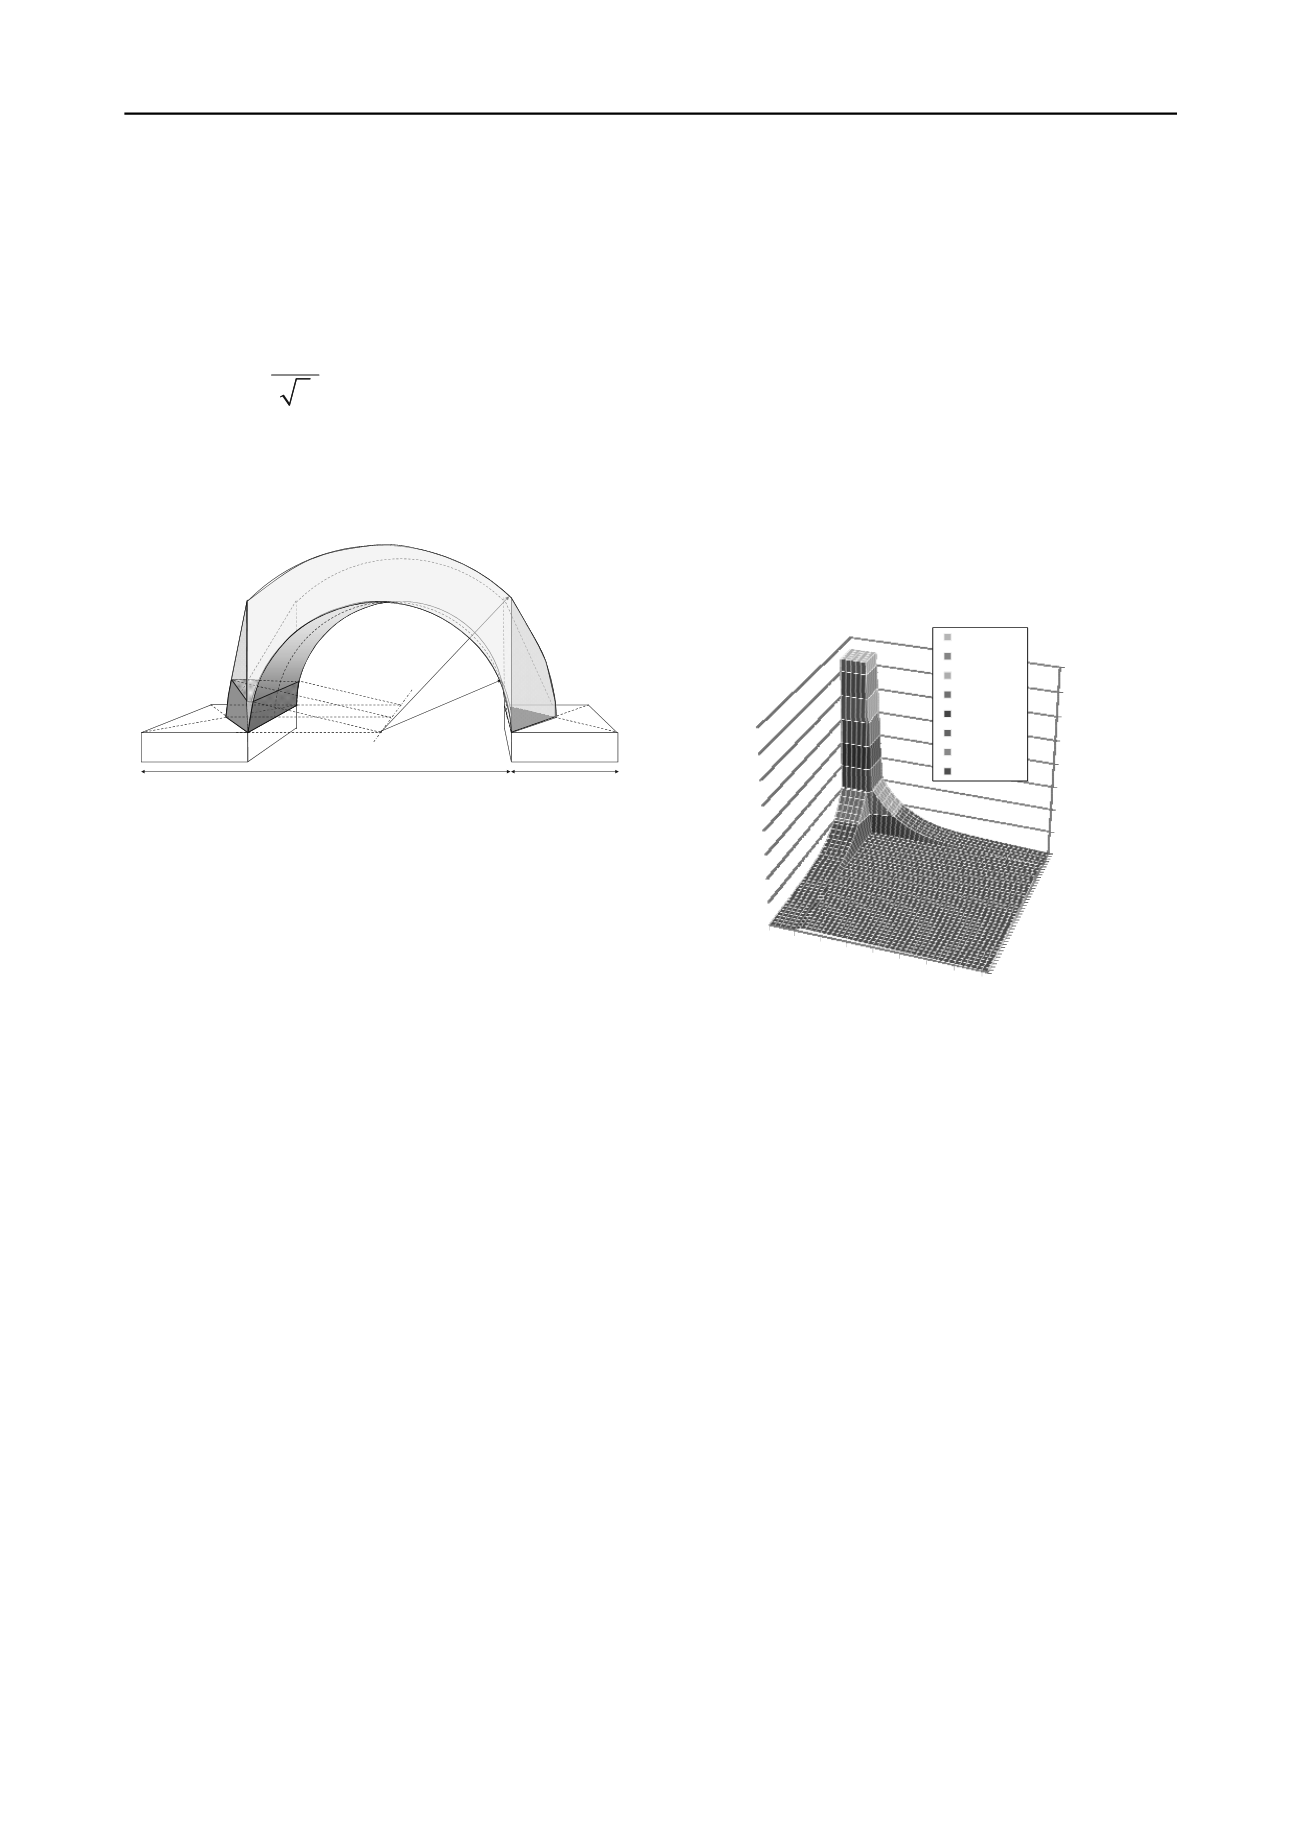
5 CONCENTRIC ARCHES (VAN EEKELEN ET AL.
2013B)
In the concentric arches model, 3D concentric arches
(hemispheres) occur above the square between each four piles
(Figure 4). These hemispheres exert part of the load to their
subsurface, the square between the four piles. The rest of load is
transported laterally in the direction of the GR strips. The load
is then further transported along the 2D arches, in the direction
of the pile caps. The 2D arches also exert part of the load to the
subsurface (the GR). Thus, both the 3D hemispheres and the 2D
arches exert a load on its GR subsurface, and this exerted force
increases towards the exterior. The part of the load not resting
on the GR is the load on the piles (arching
A
).
Following Hewlett and Randolph (1988), the radial stress
r
and tangential stress
in the 2D and 3D arches is calculated
by assuming radial equilibrium of the crown element and
assuming that:
- The principal stresses follow the arches with
the major
principal stress and
r
the minor principal stress. These
concentric hemispherical stress paths were observed in
several numerical studies, like Vermeer (2010) and
Nadukuru and Michalowski (2012).
- The arches are in a nearly-plastic situation (equation (1)).
The forces exerted on the subsurface (the GR) are calculated
by integrating the tangential stress over the GR area. This is
fully elaborated and presented in Van Eekelen et al. (2013b).
Figure 6 presents the resulting load distribution on the GR
subsurface. The figure shows that the load is indeed
concentrated on the GR strips, and the load distribution on the
GR strips indeed approaches the inversed triangular load
distribution found earlier in model tests, numerical analysis and
field measurements (Van Eekelen et al., 2012a, b and 2013a).
0.275
0.231
0.191
0.152
0.112
0.073
0.033
0
200
400
600
800
1000
1200
1400
1600
0.275
0.224
0.178
0.132
0.086
0.040
1400-1600
1200-1400
1000-1200
800-1000
600-800
400-600
200-400
0-200
Figure 6. Pressure exerted on the GR subsurface by the arches and
hemispheres of the concentric arches model.
6 DISCUSSION
Both Hewlett and Randolph (1988) and Zaeske (2001)
determine the pressure exerted on the GR at the central point
between four piles only. They continue with assuming that the
entire GR area is loaded with this pressure, thus resulting in an
equally distributed load on the GR. The concentric arches
model, however, gives a load distribution that resembles the
observed load distribution: a concentration on the GR strips
between adjacent piles, and approximately an inversed
triangular load distribution on the GR strips.
All three considered models obtained the load distribution
(Efficacy
E
, which is the ratio pile load (A in kN/pile) / total
load (
A+B+C
in kN/pile), thus
E = A/(A+B+C)
) while
assuming that the surcharge load
p
= 0. Afterwards, the
resulting
A
p=0
and (
B+C)
p=0
are multiplied with
(
H+p)/(
H)
to
obtain
the
A
and
B+C
for surcharge load
p>0.
This results in
robust calculation models.
Hewlett and Randolph (1988) as well as Zaeske (2001)
compared their analytical model with measurements in scaled
model tests without GR. As discussed before, it would be better
to compare with measurements in situations with GR.
Van Eekelen et al. (2013b) give many comparisons between
the three models and results of scaled model tests, field
measurements and numerical calculations. All with GR. Figure
7 shows a comparison with numerical calculations of Le Hello
et al. (2009), Figure 8 with field measurements in a high way
exit in Woerden (Van Eekelen et al. 2012c). In these figures is
H
(m) the embankment height,
a
(m) the (equivalent) width
square pile cap,
d (m)
the (equivalent) diameter of circular pile


