 
          1276
        
        
          Proceedings of the 18
        
        
          th
        
        
          International Conference on Soil Mechanics and Geotechnical Engineering, Paris 2013


            H


          of 60 mm, mean diameter


            D


          50
        
        
          of 0.21 mm, and uniform
        
        
          coefficient


            U


            c


          of 1.70


            .


          Reinforced roadbeds were introduced in Cases 3 and 4. A
        
        
          Toyoura sand roadbed (


            D


          r
        
        
          = 90%,


            H


          = 60 mm) was overlain by
        
        
          an asphalt mixture layer in Case 3, and a Natom sand roadbed
        
        
          (


            D


          r
        
        
          = 95%,


            H


          = 60 mm) was overlain by the same asphalt
        
        
          mixture layer in Case 4. The


            D


          50
        
        
          of the Natom sand was 0.70
        
        
          mm, and its


            U


          c
        
        
          was 3.09. The 10 mm thick asphalt mixture was
        
        
          composed of straight asphalt 80–100 and sands.
        
        
          Table 1. Model ground conditions
        
        
          Cyclic loadings were applied to the model grounds with
        
        
          footing at a constant displacement rate of 0.05 mm/s. The
        
        
          amplitude of the cyclic stress applied in Case 1 was 110 kN/m
        
        
          2
        
        
          ;
        
        
          that applied in Cases 2, 3, and 4 was 80 kN/m
        
        
          2
        
        
          . During the
        
        
          cyclic loadings, consecutive images of the model grounds were
        
        
          captured by a digital camera.
        
        
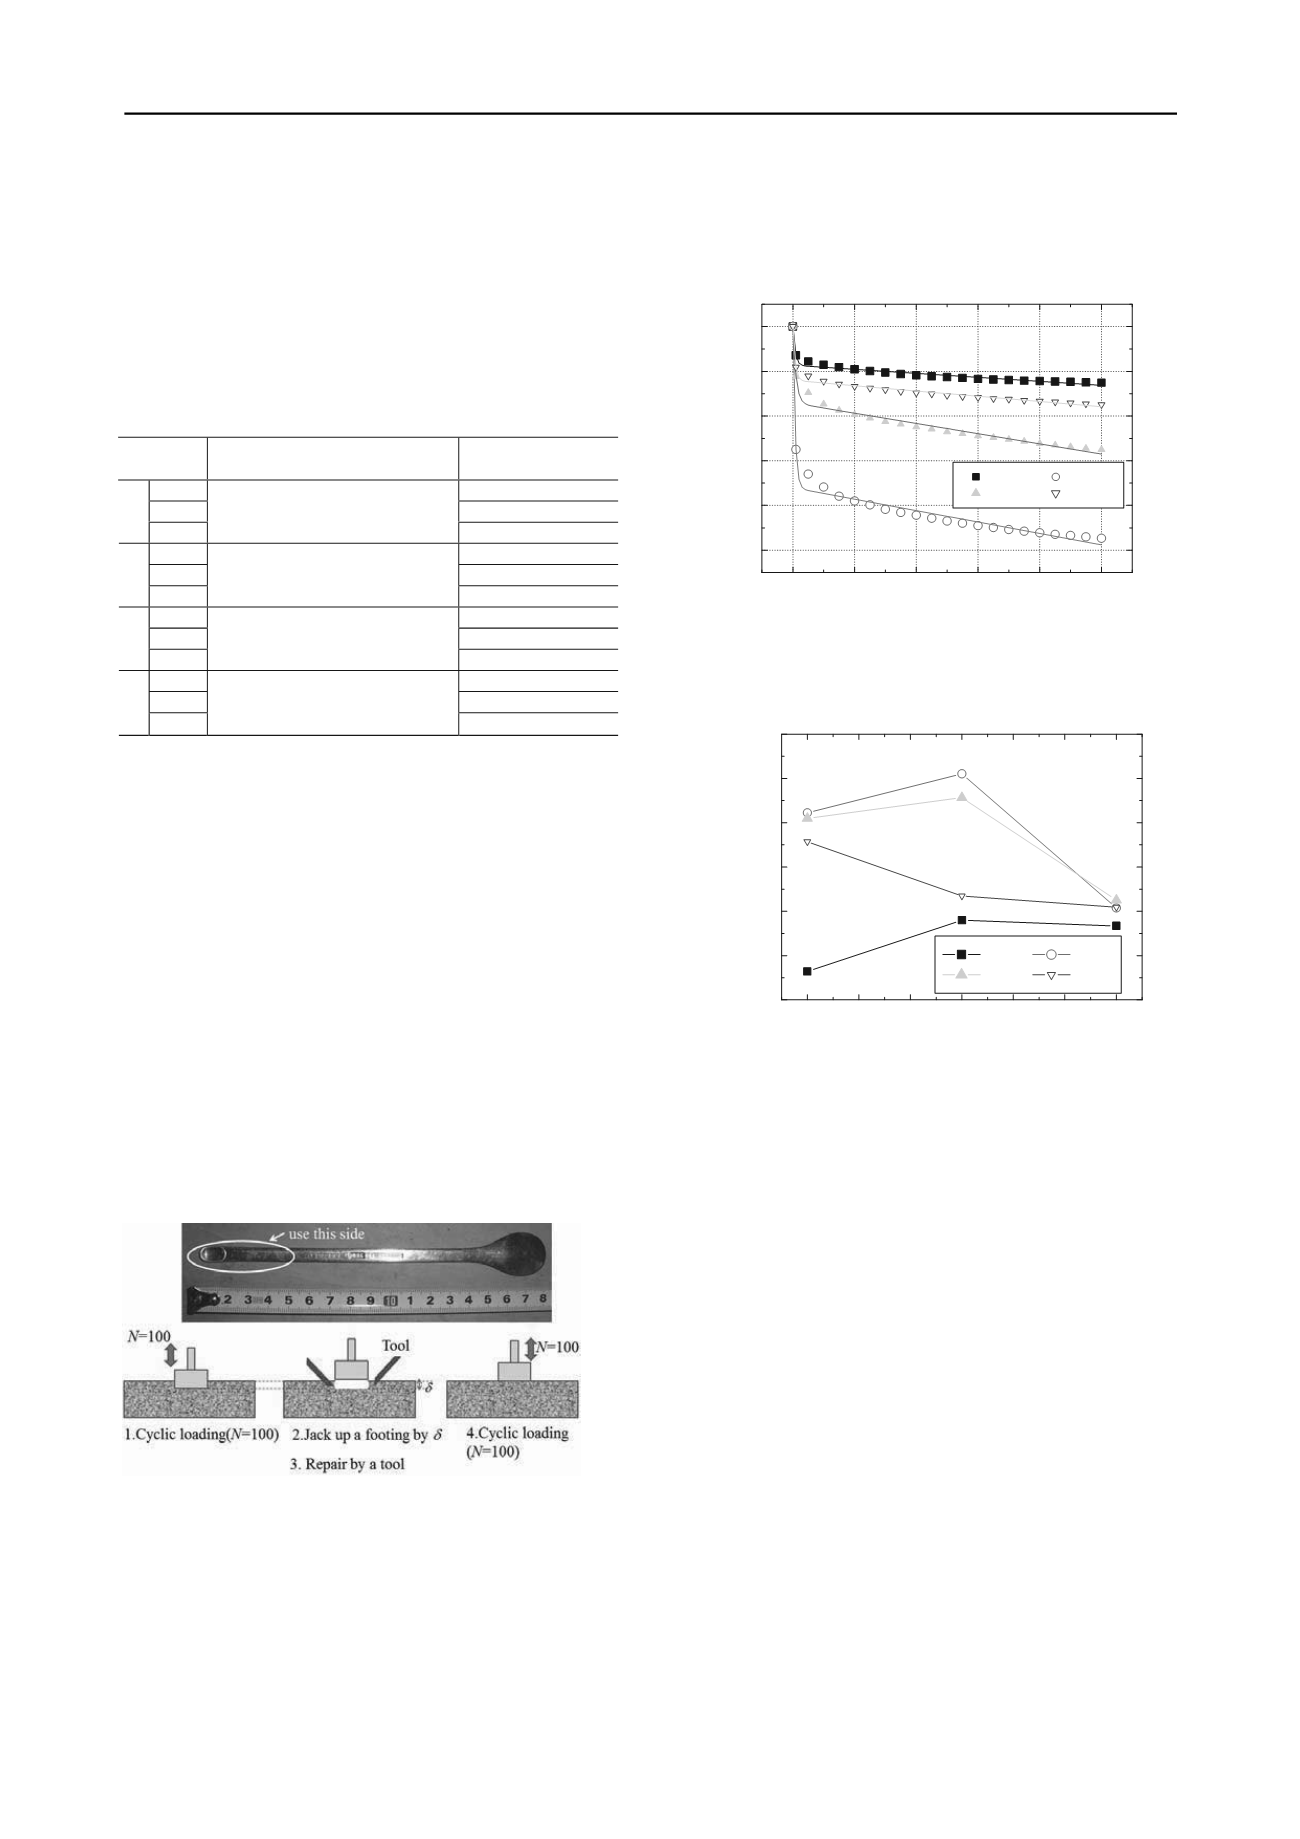
          In each test, 100 cyclic loadings were first applied. Tie-
        
        
          tamper repair modeling was performed in the following manner.
        
        
          As shown in Fig. 2, the footing was reset to the initial position
        
        
          after 100 cyclic loadings were applied. A small spoon was next
        
        
          inserted into the model ground near lateral sides of the footing.
        
        
          After the spoon reached a fixed ground depth, it was tilted
        
        
          several times to permit the crushed stones to move laterally.
        
        
          This procedure was followed at several locations until the voids
        
        
          between the footing and the ground surface were completely
        
        
          filled by the crushed stones. Finally, additional crushed stones
        
        
          were introduced to the ground surface near the footing sides to
        
        
          produce a flat ground surface. After this tie-tamper modeling
        
        
          was implemented, 100 of cyclic loadings were applied again.
        
        
          Figure 2. Tool and procedure used for simulating tie-tamper repair
        
        
          3 RESIDUAL DEFORMATION CHARACTERISTICS


            3.1 Effects of ballast thickness


          The relationships between the number of cyclic loadings


            N


          and
        
        
          footing settlement


          were obtained before and after tie-tamper
        
        
          repair, as shown in Fig. 3. Each relationship obtained could be
        
        
          fitted by the following equation
        
        
          2)
        
        
          :


            N


            e C


            N


          1
        
        
          (1)
        
        
          where


            C


          and


          are parameters representing the initial settlement
        
        
          process, and


          represents the process of gradual subsidence.
        
        
          0
        
        
          20
        
        
          40
        
        
          60
        
        
          80
        
        
          100
        
        
          10
        
        
          8
        
        
          6
        
        
          4
        
        
          2
        
        
          0
        
        
          Case1-2
        
        
          Case2-2
        
        
          Case3-2
        
        
          Case4-2


            H


          b
        
        
          =50mm
        
        
          Number of cyclic loading ,


            N


          Settlement of footing
        
        
          ,


          (mm)
        
        
          Figure 3. Relationships between number of cyclic loading cycles and
        
        
          footing settlement before tie-tamper implementation. Ballast thickness,


            H


          b
        
        
          , = 50 mm
        
        
          Figure 4. Relationships between gradual subsidence parameter


          and
        
        
          ballast thickness


            H


          b
        
        
          before tie-tamper implementation
        
        
          Figure 4 shows the relationships between the gradual
        
        
          subsidence parameter


          and ballast thickness


            H


          b
        
        
          before tie-
        
        
          tamper implementation. It should be noted that 50 mm


            H


          b
        
        
          was
        
        
          used to represent the 250 mm ballast thickness adopted for the
        
        
          standard design because the model size was at a scale of one-
        
        
          fifth. Interestingly, it is seen in the figure that


          was highest
        
        
          when


            H


          b
        
        
          = 50 mm in Cases 2 and 3. High


          values indicate a
        
        
          substantial amount of gradual settlement; thus, these results
        
        
          suggest that the standard ballast thickness of 250 mm is
        
        
          ineffective for minimal settling.
        
        
          The residual settlement characteristics were investigated in
        
        
          detail with PIV analysis. First, the displacement magnitude and
        
        
          direction of crushed stones and roadbeds induced by 100 cyclic
        
        
          loadings were estimated by analyzing consecutive digital
        
        
          images. The distributions of maximum shear strain


          max
        
        
          generated in the crushed stones and roadbeds were next
        
        
          calculated. Figures 5 to 7 show the results obtained from Cases
        
        
          1, 2, and 3. Results could not be obtained from Case 4 because
        
        
          the monotonic color of dark gray Natom sand resulted in
        
        
          ineffective pattern matching of PIV.
        
        
          As shown in Fig. 5, a high value of


          max
        
        
          was noted in Cases
        
        
          1-1 and 1-2 until the ground depth reached the bottom steel
        
        
          plate. However, the concentration of


          max
        
        
          could not be observed
        
        
          in Case 1-3 near the bottom steel plate. Similarly, the
        
        
          concentration of


          max
        
        
          could not be observed in the roadbeds for
        
        
          Cases 2-3 and 3-3, as shown in Figs. 6 and 7. These results
        
        
          indicate that when


            H


          b
        
        
          = 80 mm,


          max
        
        
          can be sustained in
        
        
          Case No.
        
        
          Roadbed
        
        
          Ballast thickness


            H


          b
        
        
          (mm)
        
        
          1-1
        
        
          20
        
        
          1-2
        
        
          50
        
        
          1
        
        
          1-3
        
        
          Steel (Bottom plate of a sand
        
        
          box)
        
        
          80
        
        
          2-1
        
        
          20
        
        
          2-2
        
        
          50
        
        
          2
        
        
          2-3
        
        
          Toyoura sand (


            D


          r
        
        
          = 90%,


            H


          =
        
        
          60 mm)
        
        
          80
        
        
          3-1
        
        
          20
        
        
          3-2
        
        
          50
        
        
          3
        
        
          3-3
        
        
          Toyoura sand (


            D


          r
        
        
          = 90%,


            H


          =
        
        
          60 mm) + Asphalt mixture
        
        
          (layer thickness = 10 mm)
        
        
          80
        
        
          4-1
        
        
          20
        
        
          4-2
        
        
          50
        
        
          4
        
        
          4-3
        
        
          Natom sand (


            D


          r
        
        
          = 95%,


            H


          = 60
        
        
          mm) + Asphalt mixture (layer
        
        
          thickness = 10 mm)
        
        
          80
        
        
          20 30 40 50 60 70 80
        
        
          0.000
        
        
          0.005
        
        
          0.010
        
        
          0.015
        
        
          0.020
        
        
          0.025
        
        
          0.030
        
        
          Case1
        
        
          Case2
        
        
          Case3
        
        
          Case4


          Ballast thickness,


            H


          b
        
        
          (mm)