 
          1285
        
        
          Technical Committee 202 /


            Comité technique 202


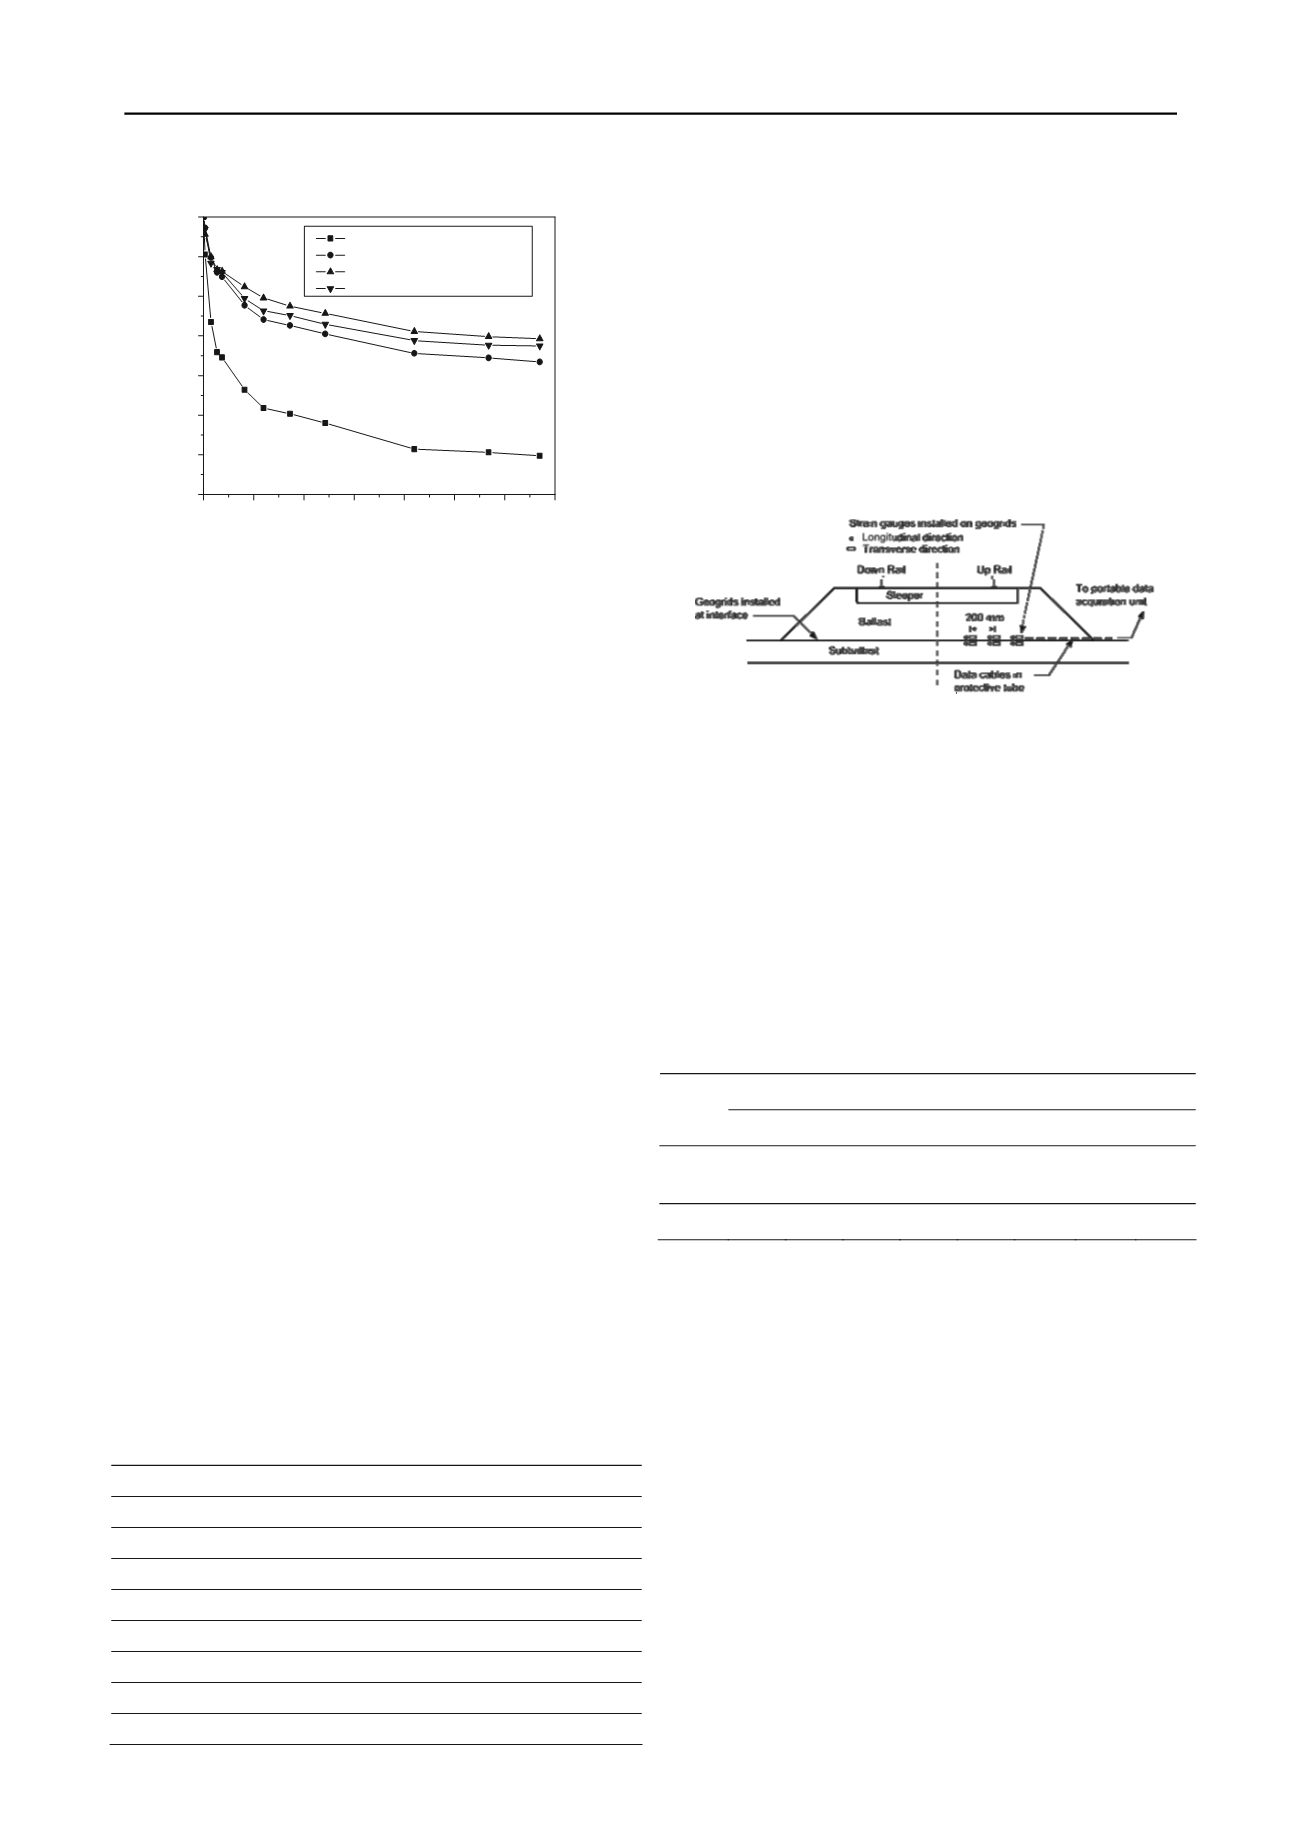
          Figure 4. In-situ response of the ballast layer: lateral deformations (data
        
        
          sourced from Indraratna et al. 2010).
        
        
          3.3


            Lateral ballast deformations


          Average lateral deformations of ballast are plotted against
        
        
          y high
        
        
          indicate
        
        
          o investigate the performance of different types of
        
        
          study was also undertaken on an
        
        
          instrumented track se
        
        
          Singleton,
        
        
          Newcastle.
        
        
          4.1


            Site geology and


            nstruction


          Nine experimental se
        
        
          ere included in the trial track
        
        
          while it was under con
        
        
          , on three diffe
        
        
          of sub-
        
        
          grades, including (i) th
        
        
          ely soft gener
        
        
          vial
        
        
          silt clay deposit (S
        
        
          1-4 and Sec
        
        
          the
        
        
          intermediate cut siltsto
        
        
          tions 5 and


            C


          ),
        
        
          he stiff
        
        
          reinforced concrete bri
        
        
          k supported by piled abutment
        
        
          (Section B), as shown in Table 2. Further details of track
        
        
          construction and material specifications c
        
        
          und in
        
        
          Indraratna et al. (2012c).
        
        
          the number of load cycles (


            N


          ) in Figure 4. The recycled ballast
        
        
          with moderately graded particle size distribution (


            C


            u


          = 1.8)
        
        
          showed less lateral deformations compared to the very uniform
        
        
          fresh ballast (


            C


            u


          = 1.5). Recycled ballast often shows less
        
        
          breakage because the individual particles are more rounded
        
        
          which prevents high angular corner breakage caused b
        
        
          in Figure 4
        
        
          stress concentrations. The results presented
        
        
          that the geocomposite reduced lateral deformation of fresh
        
        
          ballast by about 49 % and that of recycled ballast by 11 %. The
        
        
          apertures of the geogrid offered strong mechanical interlocking
        
        
          with the ballast. The capacity of the ballast to distribute loads
        
        
          was improved by the placement of the geocomposite, which
        
        
          substantially reduced settlement under high repeated loading.
        
        
          4 USE OF GEOSYNTHETICS FOR STABILISING A
        
        
          BALLASTED TRACK: SINGLETON CASE STUDY
        
        
          T
        
        
          geosynthetics for improving the overall track stability under in
        
        
          situ conditions, an extensive
        
        
          ctions in
        
        
          near the City of


            track co


          ctions w
        
        
          struction
        
        
          rent types
        
        
          e relativ
        
        
          ections
        
        
          al fill and allu
        
        
          tion


            A


          ), (ii)
        
        
          y
        
        
          ne (Sec
        
        
          and (iii) t
        
        
          dge dec
        
        
          a
        
        
          an be fo
        
        
          Table2. Reinforcement at experimental sections using geogrids,
        
        
          geocompolistes, and shock mats.
        
        
          Section
        
        
          Location
        
        
          Reinforcement
        
        
          A
        
        
          234.75
        
        
          -
        
        
          1
        
        
          234.66
        
        
          Geogrid 1
        
        
          2
        
        
          234.40
        
        
          Geogrid 2
        
        
          3
        
        
          234.22
        
        
          Geogrid 3
        
        
          4
        
        
          234.12
        
        
          Geocomposite
        
        
          B
        
        
          232.01
        
        
          4.2


            Track instrumentation


          Shock mat
        
        
          C
        
        
          228.50
        
        
          -
        
        
          5
        
        
          228.44
        
        
          Geogrid 3
        
        
          The strain gauges were installed in groups, 200 mm apart, and
        
        
          ds in both longitudinal and
        
        
          5.
        
        
          ls o k i
        
        
          me
        
        
          n
        
        
          str
        
        
          uge
        
        
          4.3
        
        
          ared,
        
        
          grade
        
        
          ncrete
        
        
          on the top and bottom sides of the gri
        
        
          transverse directions (Figure 5). The strain gauges were of a
        
        
          post-yield type suitable to measure strains in the range of 0.1 to
        
        
          15%. Two pressure cells were installed at Sections 1, 5,


            A


          and


            C


          . At these locations, one pressure cell was installed at the
        
        
          sleeper-ballast and another at the ballast-sub-ballast interface.
        
        
          At Section


            B


          , three pressure cells were installed at the synthetic
        
        
          mat-deck interface. Settlement pegs were also installed at the
        
        
          sleeper-ballast and ballast-sub-ballast interfaces to measure the
        
        
          vertical deformations of the ballast layer.
        
        
          Figure Detai
        
        
          f trac nstru ntatio using ain ga s.


            Vertical ballast deformations


          The settlements (


            s


            v


          ) and vertical strains (


            v


          ) of the ballast layer
        
        
          after 2.3


          10
        
        
          5
        
        
          load cycles are reported in Table 3. The vertical
        
        
          settlements of sections with reinforcement are generally smaller
        
        
          than those without reinforcement. This observation is mainly
        
        
          attributed to the effective interlocking between the ballast
        
        
          particles and grids, thus inducing increased track confinement
        
        
          as explained earlier. When sections


            a


          ,


            b


          , and


            c


          are comp
        
        
          the results indicate that


            s


            v


          and


            v


          are larger when the sub
        
        
          stiffness becomes smaller, i.e.


            S


          is smallest on the co


            v


          bridge deck and largest at the alluvial deposit.
        
        
          Table 3. Vertical deformation and strain of ballast after 2.3


          10
        
        
          5
        
        
          load
        
        
          cycles.
        
        
          Instrumented section details
        
        
          1
        
        
          2
        
        
          3
        
        
          4
        
        
          5
        
        
          A
        
        
          B
        
        
          C


            S


            v


          (mm)
        
        
          16.3
        
        
          21.2
        
        
          14.8
        
        
          16.0
        
        
          16.3
        
        
          23.8
        
        
          8.8
        
        
          17.8


            v


          (%)
        
        
          5.4
        
        
          7.1
        
        
          4.9
        
        
          5.3
        
        
          5.4
        
        
          7.9
        
        
          2.9
        
        
          5.9
        
        
          It is also observed that the geogrid is more effective in terms
        
        
          ported by Ashmawy and
        
        
          Bourdeau (1995) thorough
        
        
          geogrid at
        
        
          Section 3 performed better, although the tensile strength did not
        
        
          differ much with the other types.
        
        
          is is a
        
        
          um aperture size (40 mm) which would enable better
        
        
          cking between the b parti
        
        
          d the rid.
        
        
          4.4


            Strains accumulation in


            geocomposites


          ins after
        
        
          of reducing track settlement for relatively weak subgrades.
        
        
          Similar observations have been re
        
        
          full scale testing.  The
        
        
          Th
        
        
          ttributed to the
        
        
          optim
        
        
          interlo
        
        
          allast
        
        
          cles an geog


            geogrids &


          Accumulated longitudinal (


            l


          ) and transverse (


            t


          ) stra
        
        
          2.3


          10
        
        
          5
        
        
          load cycles are given in Table 4. The transverse strains
        
        
          were generally larger than the longitudinal strains, and this is
        
        
          attributed to the ease of lateral spreading of the ballast layer
        
        
          upon loading. It was also observed that


            l


          and


            t


          were mainly
        
        
          influenced by the subgrade deformations. The strains of geogrid
        
        
          at Section 4 were relatively large although its higher stiffness
        
        
          could have resulted in smaller strains. This is because, the
        
        
          thicker general fill underwent large lateral deformations shortly
        
        
          after the track was commissioned. Induced transient strains in
        
        
          both longitudinal and transverse directions due to the passage of
        
        
          0
        
        
          1x10
        
        
          5
        
        
          2x10
        
        
          5
        
        
          3x10
        
        
          5
        
        
          4x10
        
        
          5
        
        
          5x10
        
        
          5
        
        
          6x10
        
        
          5
        
        
          7x10
        
        
          5
        
        
          -14
        
        
          -12
        
        
          -10
        
        
          -8
        
        
          -6
        
        
          -4
        
        
          -2
        
        
          -0
        
        
          Average lateral deformation of ballast, (S
        
        
          h
        
        
          )
        
        
          avg
        
        
          (mm)
        
        
          Fresh ballast (uniformly graded)
        
        
          Recycled ballast (broadly graded)
        
        
          Fresh ballast with geocomposite
        
        
          Recycled ballast with geocomposite
        
        
          Number of load cycles, N