 
          1284
        
        
          Proceedings of the 18
        
        
          th
        
        
          International Conference on Soil Mechanics and Geotechnical Engineering, Paris 2013
        
        
          2.1


            Test setup and procedure


          A steel plate of 300 mm diameter and 50 mm thickness was
        
        
          used to represent a hard base such as the deck of a bridge, or
        
        
          hard rock. A thick sand layer of 100mm thickness was used to
        
        
          simulate a typical ‘weak’ subgrade. The drop hammer was
        
        
          raised mechanically to the required height and then released by
        
        
          an electronic quick release system. After 10 blows, an
        
        
          attenuation of strains in the ballast layer was reached.
        
        
          2.2


            Single impact loading


          The impact load-time history under a single impact load is
        
        
          shown in Figure 1. Two distinct types of peak forces were seen
        
        
          during impact loading: (a) an instantaneous sharp peak with
        
        
          very high frequency


            P


            1


          , and (b) a gradual peak of smaller
        
        
          magnitude with a relatively smaller frequency


            P


            2


          (Jenkins et al.
        
        
          1974). It was also evident that multiple


            P


            1


          type peaks followed
        
        
          by the distinct


            P


            2


          type peak often occurred. The multiple


            P


            1


          peaks occurred when the drop hammer was not restrained
        
        
          vertically, so consequently it rebounded after the first impact
        
        
          and impacted the specimen again.
        
        
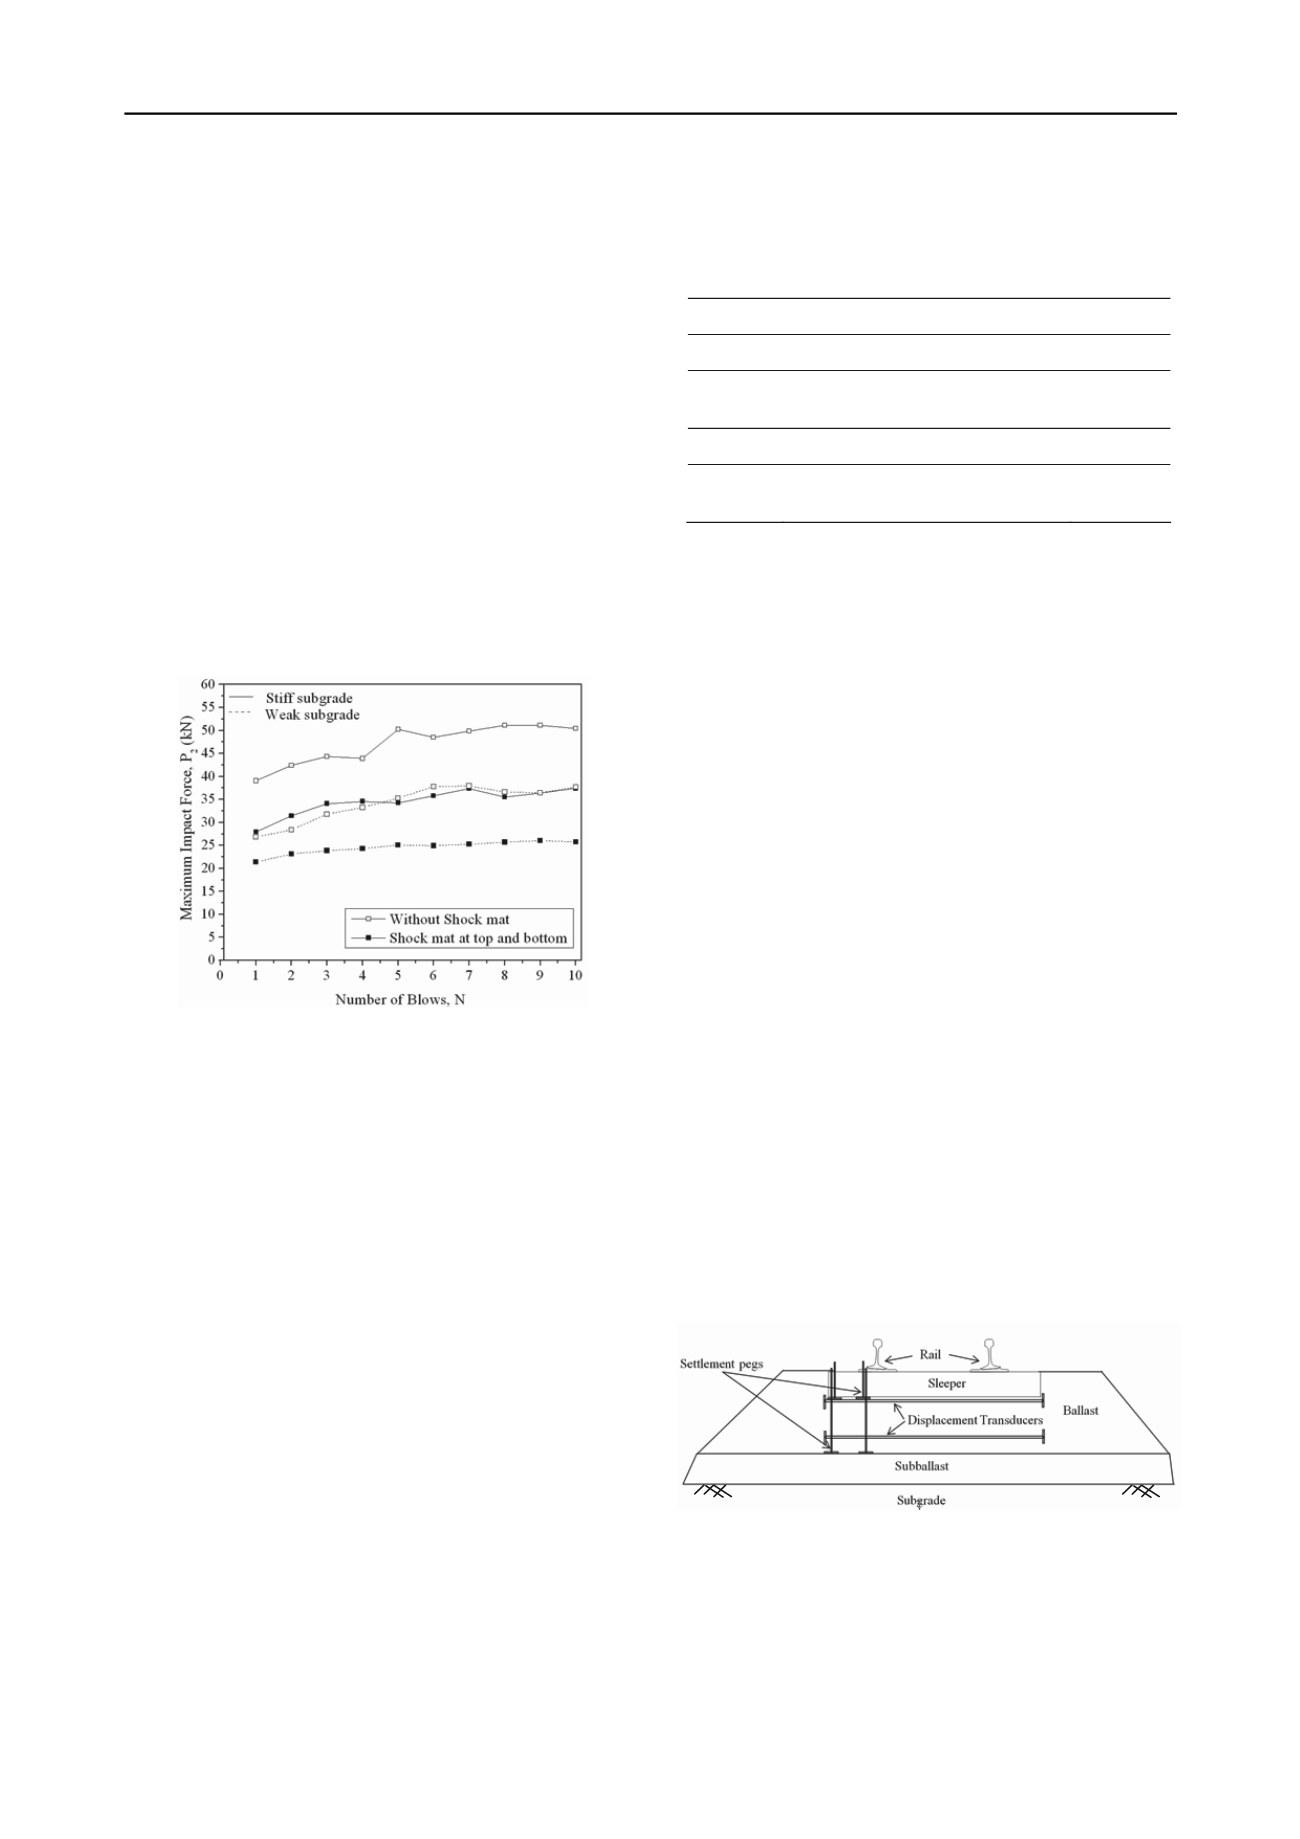
          Figure 2. Variation of impact force with number of blows (data sourced
        
        
          from Nimbalkar et al. 2012).
        
        
          2.3
        
        
          agnitude of impact force compared to a stiffer
        
        
          , 2005, Lackenby et al. 2007, Indraratna and Nimbalkar
        
        
          20
        
        
          fo
        
        
          ak sub
        
        
          s that the weak subgrade itself
        
        
          acts flexibl
        
        
          Table 1. Ballas
        
        
          ge under impact loading (Indraratna et al.,
        
        
          2011a).
        
        
          pe


            Multiple impact loading


          Figure 2 shows the variation of


            P


            2


          force peak with repeated
        
        
          hammer blows (


            N


          ). The


            P


            2


          force showed a gradual increase
        
        
          with the increased number of blows due to the densification of
        
        
          ballast. A dense aggregate matrix offers a higher inertial
        
        
          resistance which leads to an increased value of


            P


            2


          . Even without
        
        
          a shock mat, a ballast bed on a weak subgrade leads to a
        
        
          decreased m
        
        
          subgrade.
        
        
          2.4


            Particle breakage


          After each test, the ballast sample was sieved to obtain the
        
        
          ballast breakage index (BBI) as shown in Table 1. The particle
        
        
          breakage encountered under 10 impact blows was significantly
        
        
          higher than that under both static and cyclic loads (Indraratna et
        
        
          al. 1998
        
        
          11).
        
        
          The higher breakage of ballast particles can be attributed to
        
        
          the considerable non-uniform stress concentrations occurring at
        
        
          the corners of the sharp angular particles of fresh ballast under
        
        
          high impact stresses. When a shock mat was placed above and
        
        
          below the ballast bed, particle breakage was reduced by
        
        
          approximately 47% for a stiff subgrade, and approximately 65%
        
        
          r a we
        
        
          as a
        
        
          grade. This implie
        
        
          e cushion.
        
        
          t breaka
        
        
          Base ty
        
        
          Test Details


            BBI


          Stiff
        
        
          Without shock mat
        
        
          0.170
        
        
          Stiff
        
        
          Shock mat at top and bottom of
        
        
          0.091
        
        
          ballast
        
        
          Weak
        
        
          Without shock mat
        
        
          0.080
        
        
          Weak
        
        
          Shock mat at top and bottom of
        
        
          ballast
        
        
          0.028
        
        
          3 USE OF GEOSYNTHETICS FOR STABILISING A
        
        
          BALLASTED TRACK: BULLI CASE STUDY
        
        
          In order to investigate deformations of a
        
        
          caused by train traffic, and the associat
        
        
          multi-layer rail track
        
        
          ed benefits of using
        
        
          3.1
        
        
          mposite layer were
        
        
          the other two sections, fresh and
        
        
          th a layer of geocomposite at the
        
        
          The vertical and horizontal stresses induced in the track bed were
        
        
          measured by pressure cells. Vertical deformations of the track were
        
        
          measured by settlement pegs, and lateral deformations were measured
        
        
          by electronic displacement transducers. The settlement pegs and
        
        
          displacement transducers were installed at the sleeper-ballast and
        
        
          ballast-subballast interfaces, respectively, as shown in Figure 3.
        
        
          geosynthetics in fresh and recycled ballast, a field trial was
        
        
          carried out on a fully instrumented track in the town of Bulli
        
        
          north of Wollongong City [Indraratna et al. 2009, 2010]. The
        
        
          proposed site was located between two turnouts.


            Site geology and track construction


          A site investigation comprising 8 test pits and 8 Cone Penetrometer
        
        
          tests was carried out to assess the condition of the sub-surface soil
        
        
          profiles. The subgrade consisted of a stiff over consolidated silty clay
        
        
          that showed high values of cone resistance (


            q


            c


          ) and friction ratio (


            R


            f


          )
        
        
          (Robertson 1990, Choudhury 2006).
        
        
          The instrumented section of track was 60 m long and it was
        
        
          divided into four equal sections. The layers of ballast and
        
        
          subballast (capping) were 300 mm and 150 mm, respectively.
        
        
          Fresh and recycled ballast without a geoco
        
        
          used in two sections, while in
        
        
          recycled ballast was used wi
        
        
          ballast-subballast interface. The physical and technical
        
        
          specifications of the fresh ballast, recycled ballast and
        
        
          geosynthetic material used at this site have been reported
        
        
          elsewhere (Indraratna et al. 2011a, 2012a).
        
        
          3.2


            Track instrumentation


          Figure 3. Installation of settlement pegs and displacement transducers at
        
        
          Bulli site (data sourced from Indraratna et al. 2012b)