1292
Proceedings of the 18
th
International Conference on Soil Mechanics and Geotechnical Engineering, Paris 2013
conducted to profile the soil layer and to determine the potential
sand lenses as well as to correlate the parameters. Field
responses were monitored using settlement plates and
piezometers. In this paper, the data from a settlement plate
(SP18
–
See Fig. 1a) and a piezometer are used for assessing the
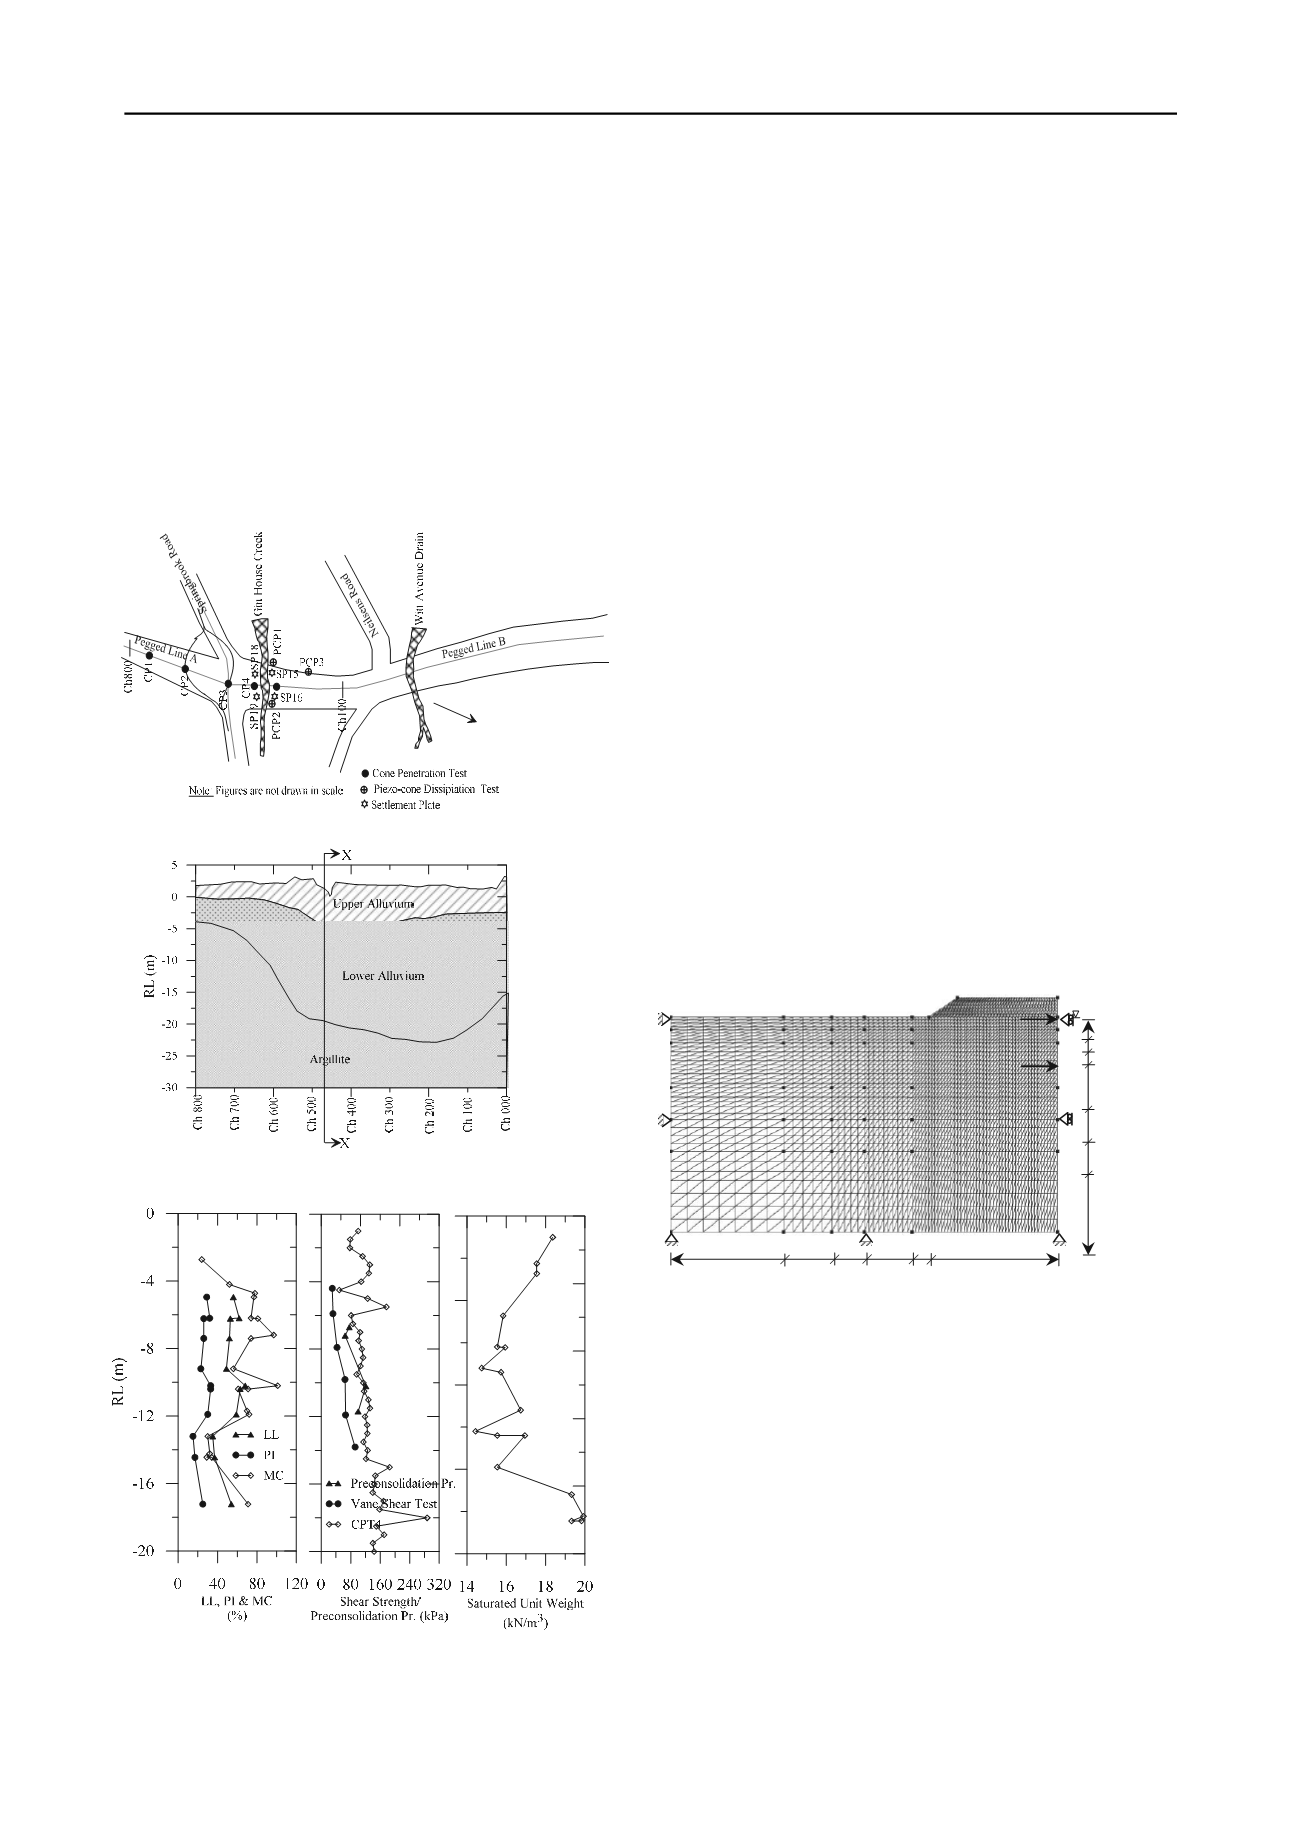
predictability of the performance. The site plan, locations of
field tests and instrumentation, along with the depths of the clay
deposits, are shown in Fig. 1.
The subsoil consisted of moisture contents from 24 to
101%, liquid limits of 35 to 68% and plasticity index of 15 to
33%. The saturated unit weight of the estuarine soft clay varied
from 14.43 to 20 kN/m
3
. The sensitivity of the soil ranged
between 3.75 to 7.00 and the undrained shear strengths of the
clay deposits obtained from field vane shear tests from 30 to 92
kN/m
3
. The soil properties of the NBR site are shown in Fig. 2.
Figure 1. (a) Site plan and (b) Soil profile along NBR
Figure 2. Foundation soil properties of NBR
The soil profile along the NBR area comprised alluvium
overlying bedrock in two distinct strata: upper alluvium and
lower alluvium. The upper alluvium consisted of a 2m thick
topsoil or silty clay overlying 2 m of loose sand. Depending on
the physical properties and compressibility characteristics; the
lower alluvium was divided into three distinct layers: Clay-1 (7
m); Clay-2 (5 m); and Clay-3 (5 m). It was observed that, in the
Clay-1 layers, the organic component was 8.4 %.
3 FINITE ELEMENT ANALYSIS
Fully coupled, elasto-plastic (Roscoe and Burland, 1968) and
elasto-viscoplastic (Karim et al., 2010) nonlinear FEA of the
NBR embankment were carried out considering plane strain
analyses using a UNSW Canberra, modified version of the FEA
program AFENA (Carter and Ballam 1995). Due to the
symmetry of the embankment section to reduce computational
time, only half part of the embankment was considered for
analysis.
The soft soil was initially modelled as an elasto-plastic
MCC material and the results were compared with those
subsequently obtained adopting the creep-based EVP model.
The sand layer in the foundation soil, argillite bed rock and
embankment fill materials were modelled as elastic perfectly
plastic materials using the Mohr-Coulomb failure criterion.
Consolidation parameters (λ and κ) were calculated from a
1-
D consolidation test data and the strength parameter (φ or M)
estimated from the correlation of the CPT and CPT-u tests. The
flow parameter (co-efficient of permeability) was back-
calculated from the CPT-u test data using the relationship
proposed in Teh and Houlsby 1991 and Karim et al. 2010. For
the CPT and CPT-u test data interpretations CPeT-IT 2012 were
used. The void ratio (
N
e
) of the in situ soil at the unit mean-
normal effective stress on the normal consolidation line, the
preconsolidation pressure (
0
c
p
) and conventional secondary
consolidation co-efficient (
C
α
) were calculated from a 1-D
consolidation of the test data. The model parameters used in
MCC and EVP models are tabulated in Tab. 1.
Figure 3. FE geometry used for 2D plane strain analysis (X-X section)
The length and width of the embankment section were 1.3
km and 40 m respectively, with the height of fill materials and
depth of its foundation 3 m and 21 m respectively. The
construction period of the embankment was 15 days. The
settlement plate was placed at RL = + 1.5 m on the centre line
of the embankment to monitor the ongoing field settlement and
the piezometer at RL = - 4.6 m to monitor the field
’s
excess
pore water pressure. The side slope of the embankment is 1V:
2H.
The finite element mesh consisted of 11,267 nodes and
5,520 elements with six noded nonlinear triangular elements
used for finite element discretisation. It was observed from the
FEAs that the predicted settlements from the MCC and EVP
models were 425.55 mm and 498.00 mm respectively for 360
days. On the other hand, the measured settlement for the same
time duration was 478.00 mm. It is evident that the MCC model
under-predicted the settlement which may have been due to
ongoing creep settlement.
RL=+4.5 m
RL=+1.5 m
RL=-0.5 m
RL=-2.5 m
RL=-9.5 m
RL=-14.5 m
RL=-19.5 m
RL=-32.5 m
2.5 m
20.0 m
7.5 m 5.0 m 7.5 m
17.5 m
(a)
(b)
Piezometer
SP
18


