 
          1021
        
        
          Technical Committee 105 /


            Comité technique 105


          Vertical stress,


            V


          Horizonatl stress,


            h


          Horizonatl stress,


            h


          Pore pressure,


            u


          Rotation
        
        
          fixities
        
        
          Beam
        
        
          elements
        
        
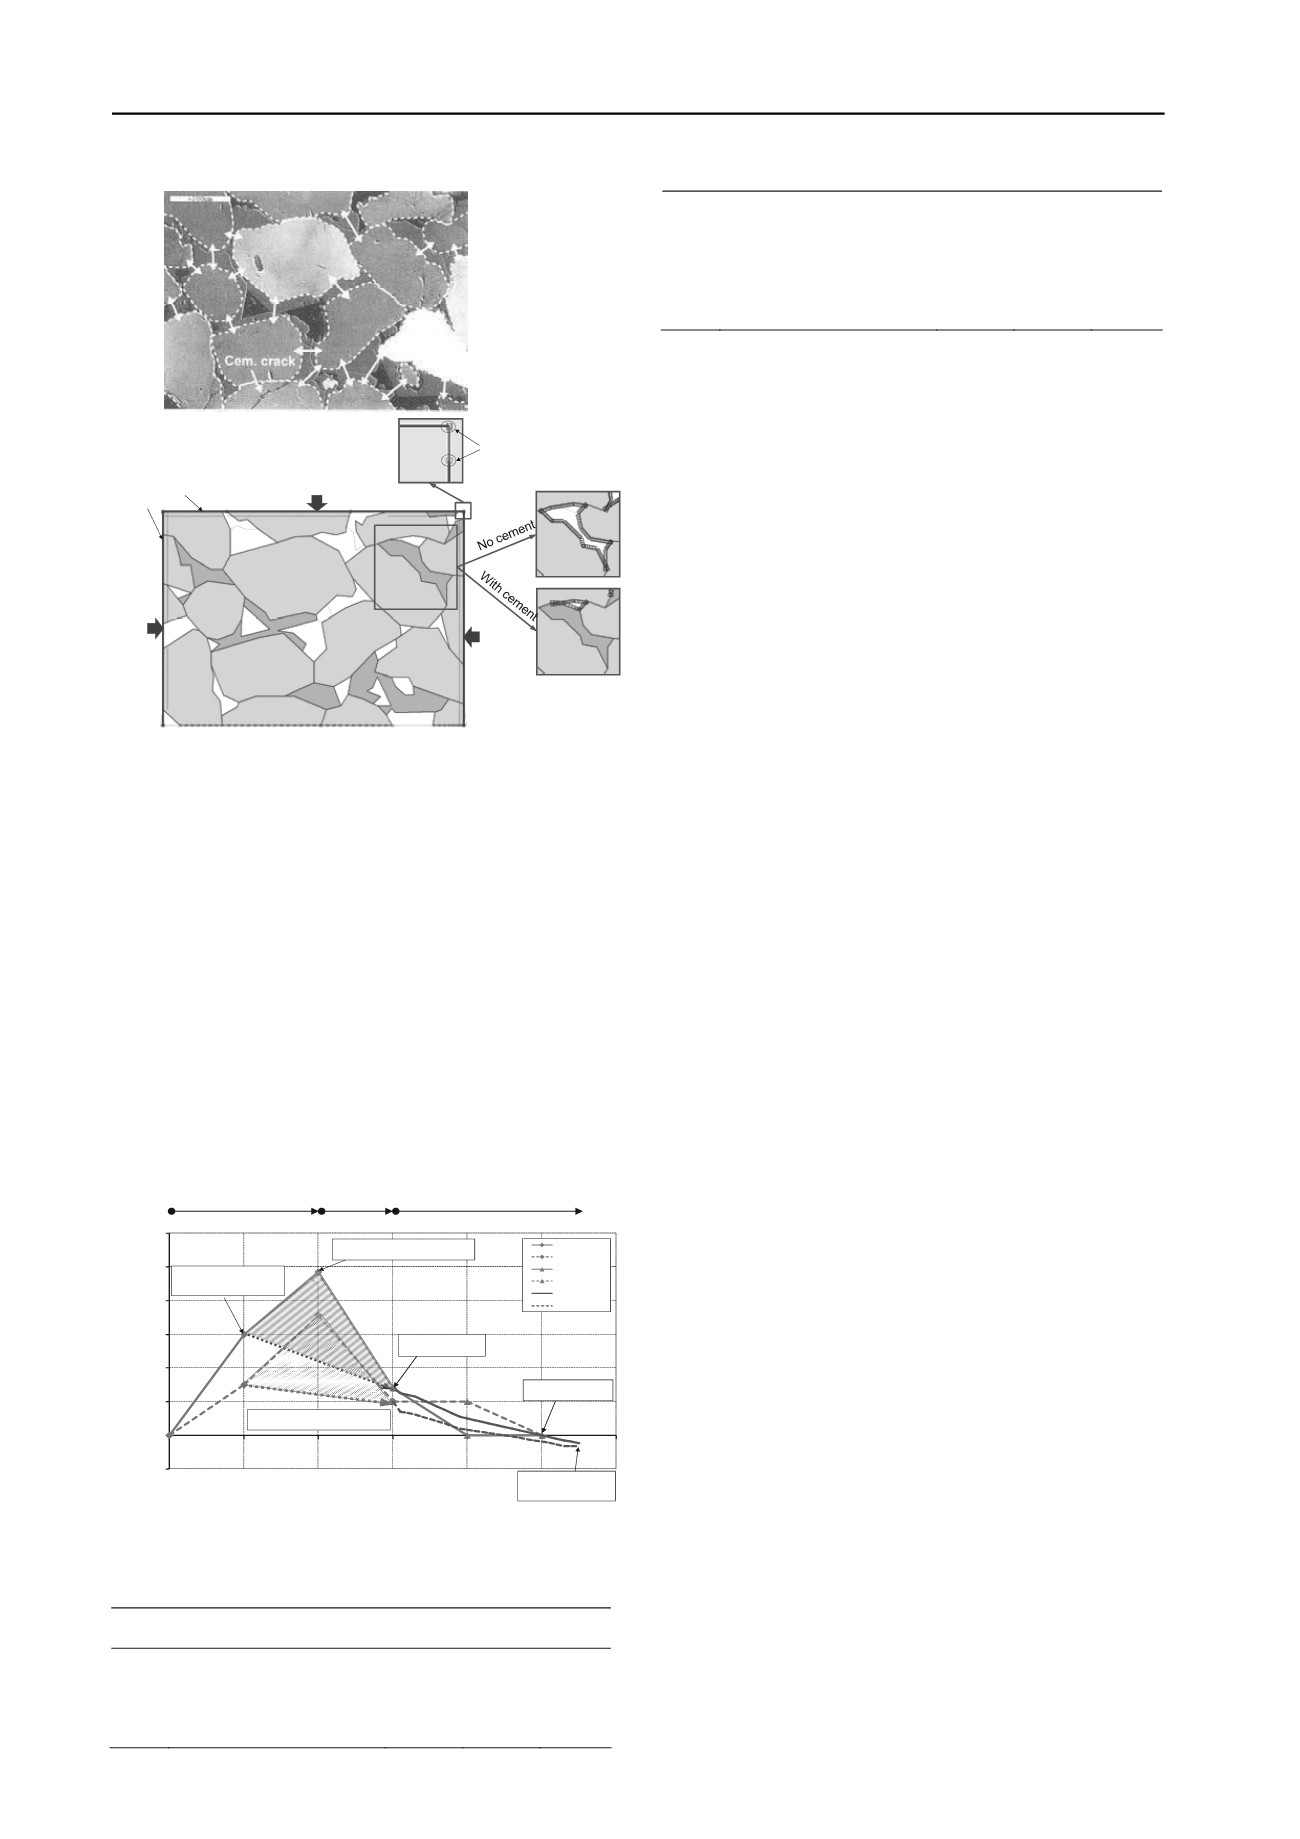
          Figure 3. Cathodoluminescence SEM picture (top) from Storvoll (2004)
        
        
          and equivalent 2D micro FE-model (bottom) used for studying
        
        
          formation damage around wellbore during drilling and coring
        
        
          operations.
        
        
          Then in the second stage the stress changes obtained from
        
        
          the macro FE-model are applied at the boundary of a micro FE-
        
        
          model in order to investigate tensile fracturing on the micro
        
        
          level. Figure 3 shows the FE-model established based on a high
        
        
          resolution cathololuminescence SEM picture of well cemented
        
        
          sandstone (from Storvoll, 2004), where authigenic quartz
        
        
          cement can clearly be separated from the original grains. For the
        
        
          deeply buried Field A which has undergone both mechanical
        
        
          and chemical compaction the cemented areas were activated at a
        
        
          stress condition corresponding to a burial depth of about 4.1 km
        
        
          corresponding to depth for onset of quarts cementation at
        
        
          temperatures of 70 - 80
        
        
          0
        
        
          C (Bjørlykke, 1989). Field B has
        
        
          undergone purely mechanical compaction due to the shallow
        
        
          burial depth (< 2.4 km), and no cement was applied for this
        
        
          model.
        
        
          -10
        
        
          0
        
        
          10
        
        
          20
        
        
          30
        
        
          40
        
        
          50
        
        
          60
        
        
          0
        
        
          1
        
        
          2
        
        
          3
        
        
          4
        
        
          5
        
        
          6
        
        
          Effective stresses (MPa)
        
        
          Loading step
        
        
          Sig'_v
        
        
          Sig'_h
        
        
          Sig'_vCoring
        
        
          Sig'_hCoring
        
        
          Sig'_vDrilling
        
        
          Sig'_tDrilling
        
        
          Approximatestressat2500 m
        
        
          beforequarts cementation
        
        
          Assuming hydrostaticpressure
        
        
          Maxpossiblestressat 4100 m TWD
        
        
          Assuming hydrostaticporepressure
        
        
          Final effectivestress
        
        
          aftercoring and retrieval
        
        
          Measured  in-situ stress
        
        
          at4100 m TVD
        
        
          Uncertain stresspath
        
        
          Porepressure history is not known
        
        
          Final effectivestress in
        
        
          formationafterdrilling and
        
        
          temperature reduction
        
        
          Coring and
        
        
          drilling
        
        
          Mechanical and
        
        
          chemical compaction
        
        
          Mechanical
        
        
          compaction
        
        
          Figure 4. Idealized stress paths for Field A. Stress changes during
        
        
          drilling and coring process are based on “macro” stresses released at
        
        
          material point A plotted in Figure 5.
        
        
          Table 2. Simplified burial history applied in micro FE-model.
        
        
          Step Description


          V
        
        
          (MPa)


          h
        
        
          (MPa)
        
        
          u
        
        
          (MPa)
        
        
          1
        
        
          At 2500 m, no cement
        
        
          55
        
        
          40
        
        
          25
        
        
          2
        
        
          At 4100 m, with cement
        
        
          90
        
        
          77
        
        
          41
        
        
          3
        
        
          At 4100 m, in-situ state


          90
        
        
          85.8
        
        
          75.8
        
        
          4
        
        
          Mud pressure & mud-flow
        
        
          88.4
        
        
          82.8
        
        
          82.2
        
        
          5
        
        
          Temperature reduction (
        
        
          0
        
        
          C)
        
        
          -
        
        
          2.4
        
        
          87.9
        
        
          82.4
        
        
          82.2
        
        
          -
        
        
          9.5
        
        
          86.4
        
        
          81.4
        
        
          82.2
        
        
          -
        
        
          19.1
        
        
          84.4
        
        
          80.0
        
        
          82.2
        
        
          -
        
        
          33.3
        
        
          82.2
        
        
          81.4
        
        
          82.2
        
        
          -
        
        
          57.1
        
        
          76.3
        
        
          74.4
        
        
          82.2
        
        
          -
        
        
          66.7
        
        
          74.4
        
        
          72.7
        
        
          82.2
        
        
          -
        
        
          71.4
        
        
          73.5
        
        
          72.6
        
        
          82.2


          V
        
        
          ,


          h
        
        
          are total vertical and horizontal stresses, respectively
        
        
          u is pore pressure
        
        
          Figure 4 shows an idealized loading path being applied to the
        
        
          micro FE-model at Field A. The stress changes during drilling
        
        
          and coring processes are based on the “macro” stresses released
        
        
          at the material Point A located at a distance of one radius into
        
        
          the formation from the wellbore wall and two radius up from
        
        
          the wellbore tip (see Figure 5). In the process of coring there is
        
        
          first a total vertical stress unloading. This corresponds to
        
        
          removing the weight of overburden during coring. Finally, the
        
        
          horizontal stress is completely unloaded. This corresponds to a
        
        
          situation after coring and core retrieval when pushing out the
        
        
          core from the core cylinder. In the formation adjacent to the
        
        
          wellbore the stress change is a combination of effect of pore
        
        
          pressure changes, temperature effects and stresses from the
        
        
          process of drilling. This is a complex process that requires FE
        
        
          modelling. Therefore the final load step has been directly taken
        
        
          from the calculated results of the macro FE-model. The
        
        
          effective vertical and effective radial stresses at Point A after
        
        
          drilling are shown in Figure 4. This includes unloading due to
        
        
          mudflow into the formation and cooling of the formation. Note
        
        
          that the final effective stresses shown in the figure corresponds
        
        
          to a cooling of about 70
        
        
          0
        
        
          C, which is a higher temperature
        
        
          reduction than experienced in the field. Also, the tangential
        
        
          stress which is most critical with respect to micro fractures is
        
        
          not shown in this figure. Table 2 summarizes the burial history
        
        
          at Field A which is applied at the boundary of a micro FE-
        
        
          model in order to investigate tensile fracturing on the micro
        
        
          level.
        
        
          3 RESULTS FROM MACRO FE-MODEL
        
        
          From the results of the 3D modelling in it is found that at a
        
        
          distance of one radius from the wellbore wall the application of
        
        
          the drill bit forces gives minor effect in terms of stress changes
        
        
          compared to the effects from mud pressure, mud-fluid flowing
        
        
          into the formation and temperature reduction. In fact, damage
        
        
          only occurs very locally at the edges of the gauge pads and
        
        
          drilling cutters. Since the effects from the drill bit can be
        
        
          neglected, for a matter of modelling simplification and also to
        
        
          minimize the time necessary for processing, a macro
        
        
          axisymmetric FE-model has been established and used for
        
        
          studying the other effects with respect to the wellbore damage.
        
        
          Figure 5 shows that the macro (continuum) analysis predicts
        
        
          tensile fracturing within one radius into the formation (point A)
        
        
          after circa 67
        
        
          0
        
        
          C of cooling. This value is not in agreement with
        
        
          field observations which indicate fracturing at much lower
        
        
          temperature differences as observed from the Radial Dipole
        
        
          Profiling data. Hence a further evaluation of tensile fracturing
        
        
          on a micro level was performed with a 2D micro FE-model
        
        
          (grain scale).
        
        
          4 RESULTS FROM MICRO FE-MODEL
        
        
          In both the Field A and the Field B case, it is found that onset
        
        
          and development of tensile fractures starts at a lower
        
        
          temperature reduction in the micro FE-model  (Figure 6) then in
        
        
          the macro FE-model (see Figure 5). The micro FE-model thus
        
        
          seems to pick up formation damage that cannot be found when
        
        
          applying a macro FE-model, and this model is closer to explain
        
        
          the observed potential stiffness reduction based on the
        
        
          difference between the mud temperature and the formation
        
        
          temperature of 25-35
        
        
          0
        
        
          C as indicated from downhole
        
        
          temperature log. There are however limitations in the 2D micro
        
        
          model and the results should only be used as a indications of