 
          1018
        
        
          Proceedings of the 18
        
        
          th
        
        
          International Conference on Soil Mechanics and Geotechnical Engineering, Paris 2013
        
        
          4 SIMULATION RESULTS
        
        
          The simulation was conducted on four specimens at
        
        
          S
        
        
          Hb
        
        
          = 0%,
        
        
          15%, 24% and 41% at a pore water pressure of 8 MPa and a
        
        
          temperature of 5C in order to compare to the experimental data
        
        
          published in Masui et al. (2005).
        
        
          S
        
        
          Hp
        
        
          is assumed to be
        
        
          approximately 26% according to the data in Masui et al. (2005).
        
        
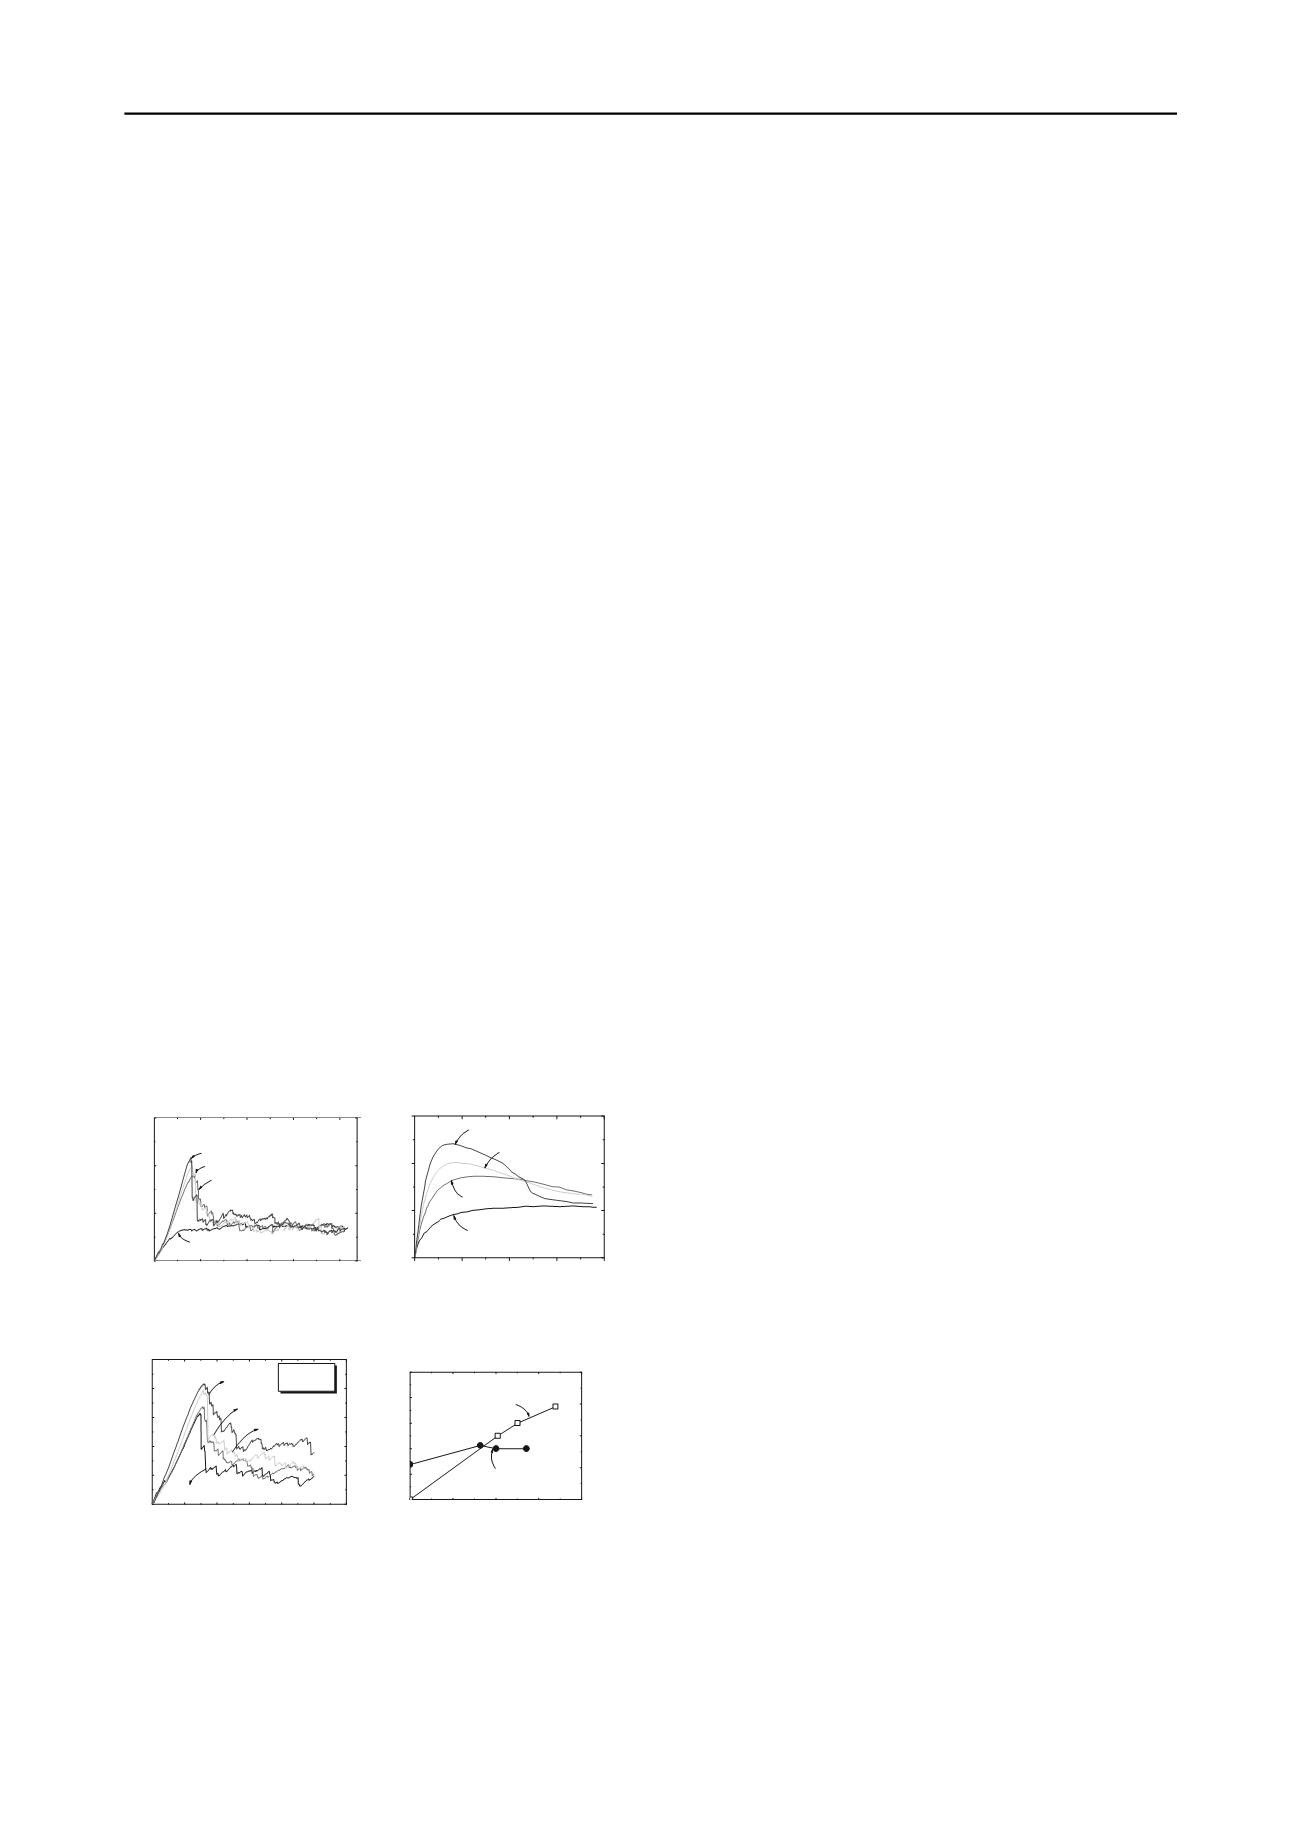
          Fig. 8 shows the simulated stress-strain response at an
        
        
          effective confining pressure of 1 MPa and test results obtained
        
        
          under the same conditions. Although the simulation can not
        
        
          quantitatively reproduce the tests, it captures the essential
        
        
          features such as strain softening at
        
        
          S
        
        
          H
        
        
          > 26%. At higher
        
        
          S
        
        
          H
        
        
          , the
        
        
          peak strength is mobilized when the axial strain exceeds
        
        
          approximately 3%, and the residual strength coincides at a large
        
        
          strain regardless of hydrate saturation due to complete breakage
        
        
          of hydrate bonds. This agrees well with experimental data.
        
        
          However the peak deviator stress obtained from the simulation
        
        
          is lower than the test results. Besides the difference between
        
        
          biaxial and triaxial tests, one of the reasons is that the bond
        
        
          tension and compression strength could be underestimated in
        
        
          the model. The size of the specimen used in material strength
        
        
          tests is much larger than inter-particle bonds in MHBS. The
        
        
          strength measured from a large specimen is much lower than
        
        
          that of a much smaller specimen.
        
        
          Fig. 9(a) presents an example of the stress-strain behavior
        
        
          under different confining pressures, which leads to a
        
        
          relationship between the peak strength parameters and
        
        
          S
        
        
          H
        
        
          as
        
        
          depicted in Fig. 9(b). The presence of hydrate cause the increase
        
        
          in cohesion, while no significant change in the internal friction
        
        
          angle is found associated with increasing
        
        
          S
        
        
          H
        
        
          . This agrees well
        
        
          with the experimental observation (Masui et al. 2005). However
        
        
          the friction angle obtained from the simulation (approximately
        
        
          20) is lower than the test data (approximately 30). This could
        
        
          be improved by introducing the inter-particle rolling resistance
        
        
          in the model. The micro parameters associated with the rolling
        
        
          resistance can be first calibrated from a simulation on a
        
        
          specimen without MH bonds in order to reach high friction
        
        
          angle. These parameters set are then brought into MHBS model.
        
        
          Considering the inter-particle rolling resistance will result in a
        
        
          higher peak deviator stress, which better matches the test data as
        
        
          shown in Fig. 8(b).
        
        
          0
        
        
          4
        
        
          8
        
        
          12 16
        
        
          0
        
        
          1
        
        
          2
        
        
          3
        
        
          S
        
        
          =67%
        
        
          0-26%
        
        
          40%
        
        
          50%
        
        
          Deviator Stress
        
        
          (
        
        
          MPa
        
        
          )
        
        
          Axial Strain
        
        
          (
        
        
          %
        
        
          )
        
        
          (a)
        
        
          0
        
        
          4
        
        
          8
        
        
          12
        
        
          16
        
        
          0
        
        
          3
        
        
          6
        
        
          9
        
        
          26.4%
        
        
          40.9%
        
        
          50.1%
        
        
          Deviator stress (MPa)
        
        
          Axial strain (%)
        
        
          S
        
        
          H
        
        
          =67.8%
        
        
          (b)
        
        
          Figure 8. Deviator stress vs. axial strain: (a) DEM simulation; and (b)
        
        
          triaxial test results performed by Masui et al. (2005)
        
        
          0 2 4 6 8 10 1
        
        
          0.0
        
        
          0.5
        
        
          1.0
        
        
          1.5
        
        
          2.0
        
        
          2.5
        
        
          2
        
        
          S
        
        
          H
        
        
          =50%
        
        
          0.7MPa
        
        
          0.52MPa
        
        
          1.1MPa
        
        
          Deviator stress
        
        
          (
        
        
          MPa
        
        
          )
        
        
          Axial strain  (%)
        
        
          1.5MPa
        
        
          (a)
        
        
          0 20 40 60 80
        
        
          0.0
        
        
          0.2
        
        
          0.4
        
        
          0.6
        
        
          0.8
        
        
          1.0
        
        
          16
        
        
          18
        
        
          20
        
        
          22
        
        
          24
        
        
          Cohesion
        
        
          Friction angle
        
        
          (
        
        
          o
        
        
          )
        
        
          Cohesion
        
        
          (
        
        
          MPa
        
        
          )
        
        
          S
        
        
          H
        
        
          (
        
        
          %
        
        
          )
        
        
          Friction angle
        
        
          (b)
        
        
          Figure 9. Simulation result (a) deviator stress vs. axial strain at different
        
        
          confining pressure for a specimen with SH=50%; and (b) peak strength
        
        
          parameters at different SH.
        
        
          5 CONCLUSIONS
        
        
          This paper proposed a two-dimensional bond contact model of
        
        
          MHBS for considering the bonding effect of MH. The bond
        
        
          strength envelope was partially derived from laboratory data.
        
        
          The model parameters are related to the hydrate saturation,
        
        
          confining pressure, temperature and density of MH. Using this
        
        
          model, the DEM simulation of the biaxial test is capable of
        
        
          capturing the major mechanical response of MHBS specimen
        
        
          such as strain softening and shear dilation at high hydrate
        
        
          saturation. This study can help to better understand the
        
        
          connection of the microscopic formation habit of MH to
        
        
          macroscopic mechanical behaviors of MHBS.
        
        
          Though the DEM simulation produced results qualitatively
        
        
          comparable to available test data, quantitative agreement
        
        
          remains still a challenge. The current model ignores the bond
        
        
          thickness, which however affects the hydrate saturation and the
        
        
          bond strength parameters. Consideration of inter-particle rolling
        
        
          resistance in the model will improve the model performance.
        
        
          Moreover, the size effect on the bond strength remains unclear
        
        
          and deserves more caution. Further investigation on these issues
        
        
          is definitely needed in the future work.
        
        
          ACKNOWLEDGEMENTS
        
        
          This work is funded by China National Funds for Distinguished Young
        
        
          Scientists (No. 51025932), and the EU FP7 IRSES grant (No. 294976).
        
        
          REFERENCES
        
        
          Brugada J. et al. 2010. Discrete element modelling of geomechanical
        
        
          behaviour of methane hydrate soils with pore-filling hydrate
        
        
          distribution.
        
        
          Granular Matter
        
        
          12(5, SI): 517-525.
        
        
          Cundall P.A. and Strack O.D.L. 1979. A discrete numerical model for
        
        
          granular assemblies.
        
        
          Géotechnique
        
        
          29(1), 47–65.
        
        
          Ellyin F. and Xia Z.H. 2006. Nonlinear viscoelastic constitutive model
        
        
          for thermoset polymers.
        
        
          Journal of Engineering Materials and
        
        
          Technology
        
        
          128:579-585.
        
        
          Hussein A. and Marzouk H. 2000. Behavior of high-strength concrete
        
        
          under biaxial stresses.
        
        
          ACI Materials Journal
        
        
          97(1):27-36.
        
        
          Hyodo M. et al. 2005. Basic research on the mechanical bahavior of
        
        
          methane hydrate-sediments mixture.
        
        
          Japanese Geotechnical Society
        
        
          45(1):75-85.
        
        
          Jiang M.J. et al. 2003. An efficient technique for generating
        
        
          homogeneous specimens for DEM studies.
        
        
          Computers and
        
        
          Geotechnics
        
        
          30(7): 579-597.
        
        
          Jiang M.J. et al. 2012a. Contact behavior of idealized granules bonded
        
        
          in two different interparticle distances: An experimental
        
        
          investigation.
        
        
          Mechanics of Materials
        
        
          55: 1-15.
        
        
          Jiang M.J. et al. 2012b. An experimental investigation on the
        
        
          mechanical behavior between cemented granule,
        
        
          Geotechnical
        
        
          Testing Journal
        
        
          (
        
        
          ASTM
        
        
          ) 35(5): 678-690.
        
        
          Jiang M.J. et al. 2006. Bond rolling resistance and its effect on yielding
        
        
          of bonded granulates by DEM analyses.
        
        
          International Journal for
        
        
          Numerical and Analytical Methods in Geomechanics
        
        
          30(8): 723-
        
        
          761.
        
        
          Jung J. et al. 2012. Stress-strain response of hydrate-bearing sands:
        
        
          Numerical study using discrete element method simulations.
        
        
          Journal of Geophysical Research-Solid Earth, 117, B04202,
        
        
          doi:10.1029/2011JB009040.
        
        
          Kupfer H. et al. 1969. Behavior of concrete under biaxial repeated
        
        
          loading.
        
        
          ACI Journal Proceedings
        
        
          66(52): 656-666.
        
        
          Kvenvolden K.A. 1988. Methane hydrate-a major reservoir of carbon in
        
        
          the shallow geosphere?
        
        
          Chemical Geology
        
        
          71(1-3):41-51.
        
        
          Masui A. et al. 2005. Effects of methane hydrate formation on shear
        
        
          strength of synthetic methane hydrate sediments.
        
        
          Proceedings of
        
        
          the 5th International Offshore and Polar Engineering Conference
        
        
          ,
        
        
          Seoul, Korea: 364-369.
        
        
          Nadreau J.P. and Michel B. 1986. Yield and failure envelope for ice
        
        
          under multiaxial compressive stresses.
        
        
          Cold Regions Science and
        
        
          Technology
        
        
          13:75-82.
        
        
          Waite W.F. et al. 2009. Physical properties of hydrate-bearing soils.
        
        
          Reviews of Geophysics
        
        
          47, RG4003:1-38.