1009
Technical Committee 105 /
Comité technique 105
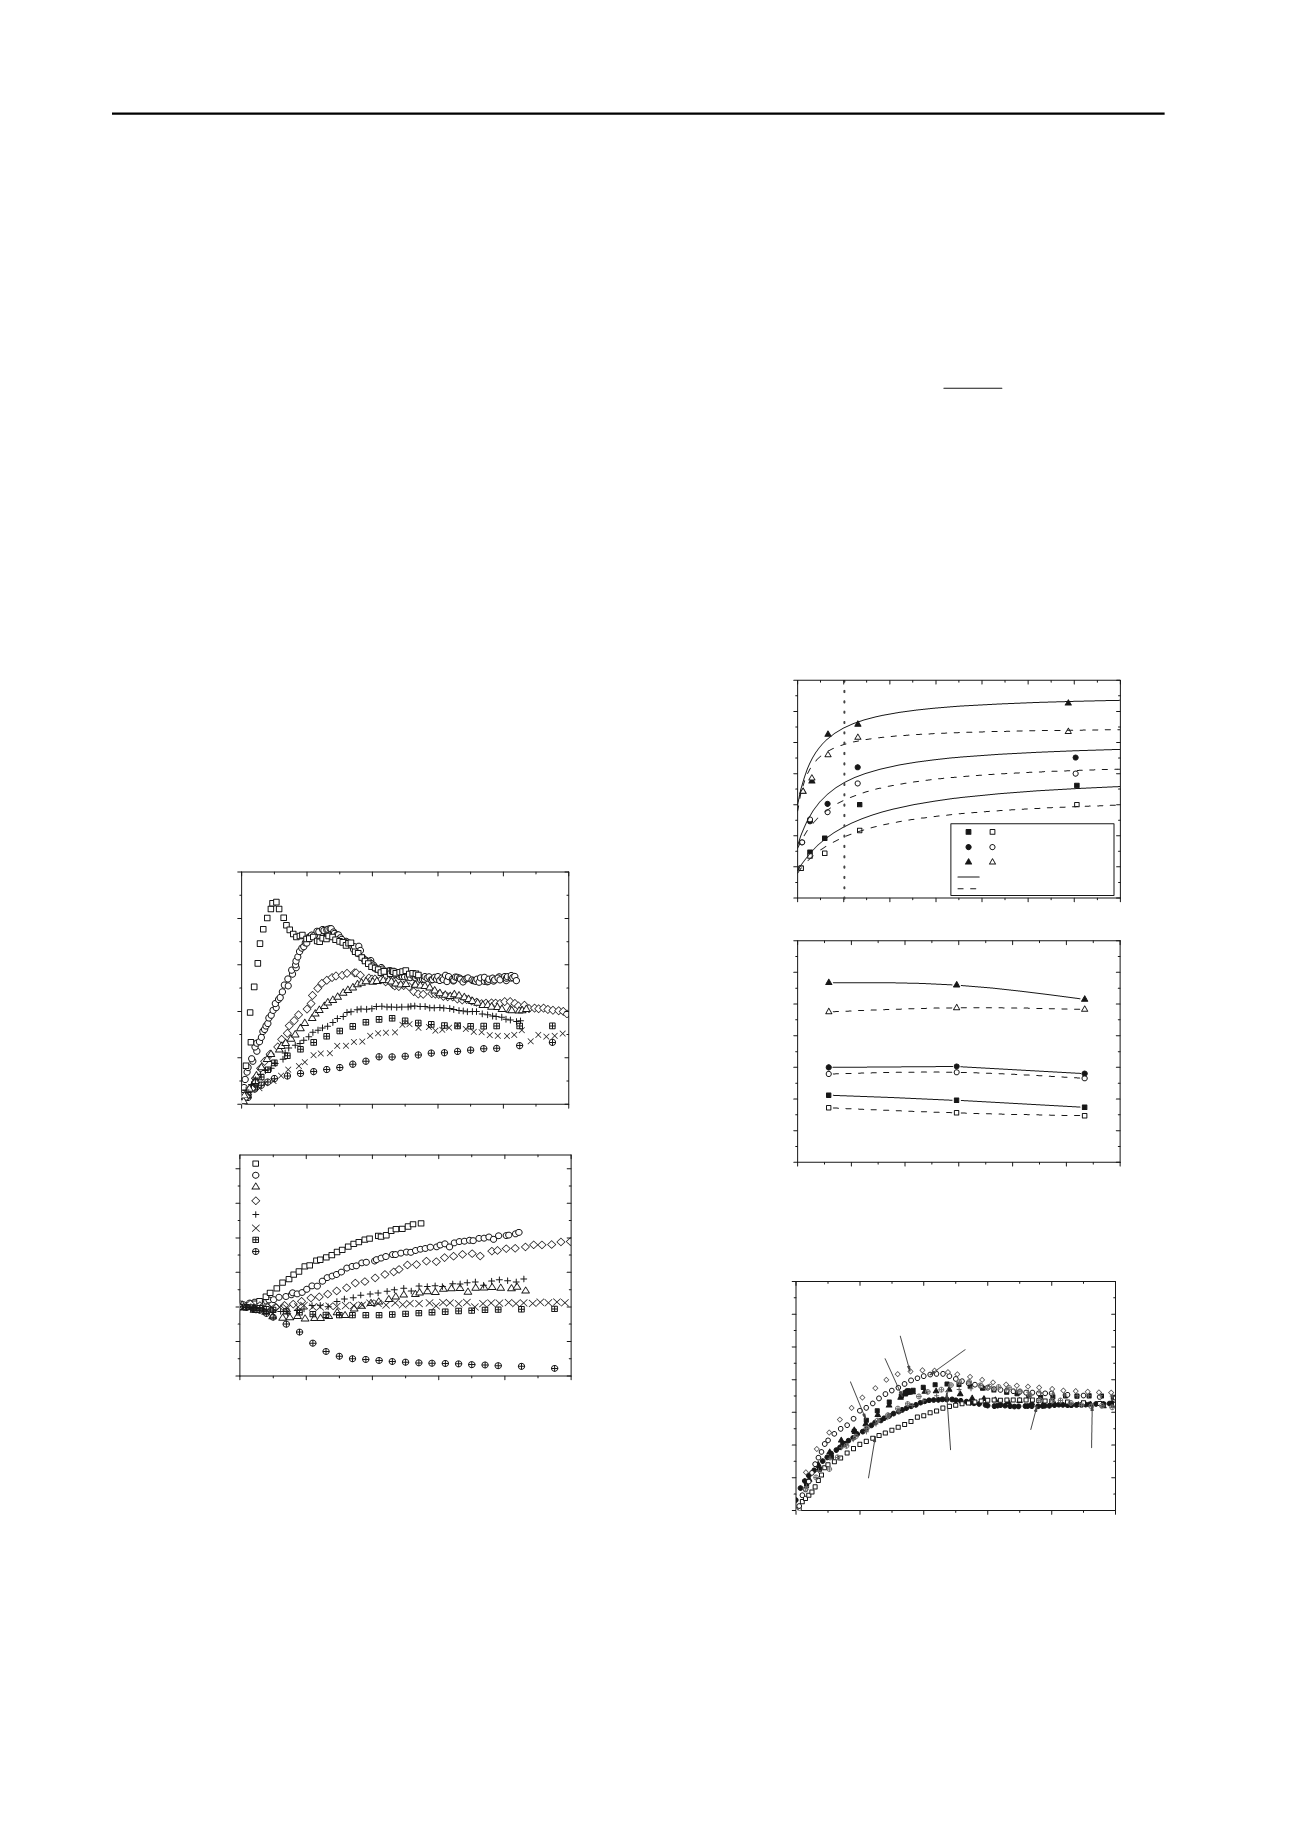
suction in a non-linear fashion, the rate of increase seems to
gradually decrease with increasing suction. Moreover, the
envelopes seem to suggest the existence of a critical suction
value, after which shear strength increase with suction is not
very significant. For this particular study this value seems to be
at suction of 100kPa, which corresponds to approximately
11.3% water content. It is interesting to note that the difference
between the peak and ultimate shear strength envelopes
increases with the applied vertical stress. This difference is
probably due to the larger reduction in void ratio attained at the
end of the compression stage for the specimens tested with
higher vertical stresses. At the beginning of the test, these
specimens have denser particle arrangement and would likely
experience a more pronounced softening behaviour that in turn
causes larger differences between the peak and ultimate shear
strength. In figure 5 (b) the peak and ultimate shear strength
data of specimens prepared at approximately the same water
content is represented with the level of compaction energy. The
peak shear strength seems to decrease with increasing energy
while ultimate shear strength is less affected. This difference
may be attributed to the fact that initial soil structure is being
erased during shearing. The differences in peak shear strength
are then probably associated with the difference in soil
structure, particularly when the line of optima is exceeded
(Figure 1, i.e. Kodikara, 2012). In addition, the specimens for
whom the compaction end states are located on the wet side of
the compaction plane may have experienced during compaction
larger pore water pressures that were quickly dissipated. This in
conjunction with the change in structure may contribute to the
deterioration of the soil strength; however, further confirmation
of this hypothesis is desirable.
0
2
4
6
8
0
20
40
60
80
100
10
Shear stress,
(kPa)
Horizontal displacement,
x (mm)
(a)
0
2
4
6
8
-1.0
-0.5
0.0
0.5
1.0
1.5
2.0
10
w
= 8.5%
w
= 10.5%
w
= 12.8%
w
= 12.6% (356kJ/m
3
)
w
= 13.0% (834kJ/m
3
)
w
= 14.0% (834kJ/m
3
)
w
= 14.1%
w
= 16.8%
Vertical displacement,
y (mm)
Horizontal displacement,
x (mm)
(b)
Figure 4. Shear tests results for an applied vertical stress of 38.4kpa in
terms of (a) shear stress and (b) vertical displacement.(w =8.5
16.8%
and E=358, 596 and 834kJ/m
3
)
3.2.2
Ultimate shear states
The ultimate shear state results were modelled using two
different approaches, namely, (a) the average skeleton stress
(Tarantino and Tombolato, 2005) and (b) critical stress ratios
(Toll and Ong 2003). Both approaches make reference to the
saturated states which were found to be relatively independent
of the compaction characteristics (Figure 6). Saturated tests
were only conducted for specimens compacted at 12.5%, given
the similarities of stress-strain behaviour between the saturated
specimens and as-compacted specimens that reached saturation
conditions during compression and shearing.
The average skeleton approach is based on the assumption
that the water menisci have a negligible effect on the ultimate
shear strength. The shear strength,
, is given by considering
the shear strength of saturated states at the same average
skeleton stress
sat
and the degree of saturation of the
macropores, or S
rm
, as follows:
w wm
sat
v
rm sat
v
wm
e e
sS
s
e e
(3)
where
e
w
and
e
are the water ratio (
e
w
=e
S
r
) and void ratio,
respectively, and
e
wm
is the microstructural water ratio. The
value of
e
wm
adopted is 0.237 and it was found by the least
squares method fitting of Eq. (3). Figure 7 (a) shows the
comparison between the measured and predicted ultimate shear
strength for all specimens, considering the average skeleton
stress defined in terms of
S
r
and
S
rm
. The prediction of shear
stress is favoured by the adoption of the
S
rm
instead of
S
r
.
Similar observations were reported by Tarantino and Tombolato
(2005) for statically compacted kaolin, despite the fact that the
fabric considered was mainly representative of the dry side of
optimum.
0
100 200 300 400 500 600 700
0
25
50
75
100
125
150
175
(a)
,
v
=38.4kPa
,
v
=79.5kPa
,
v
=146.7kPa
Peak shear strength envelopes
Ultimate shear strength envelopes
Shear stress,
(kPa)
Matric suction, s (kPa)
300
400
500
600
700
800
900
0
25
50
75
100
125
150
175
(b)
Shear stress,
(kPa)
Compaction energy, E (kJ/m
3
)
Figure 5. Shear strength envelopes for specimens compacted at (a)
energy level of 596kJ/m
3
and (b) w=12.8
13% (close and open symbols
represent peak and ultimate states, respectively).
0
2
4
6
8
0.0
0.2
0.4
0.6
0.8
1.0
1.2
1.4
10
AC-14.1(38.4)
AC 14.0(38.4)
AC-14.1(79.5)
AC-13.0(146.7)
AC-12.8(146.7)
sat-12.5(146.7)
sat-12.5(79.5)
sat-12.5(38.4)
Stress ratio ,
v
Horizontal displacement,
x (mm)
AC: As-compacted CWDST
Numbers in brackets represent vertical pressures
Figure 6. Stress ratio with horizontal displacement for saturated
drained tests (w
c
=12.5%, solid symbols) and constant water content test
at high
S
r
(open symbols).
In contrast, in the critical stress ratio approach the
contribution of the total stress and suction to the shear strength
is considered separately (Toll and Ong, 2003). The soil fabric
changes are reflected in the variation of two individual stress
ratios governed by the degree of saturation. Toll and Ong


