1017
Technical Committee 105 /
Comité technique 105
where
p
a
is standard atmospheric pressure (i.e., 0.1 MPa);
w
is
the water density at 4C;
T
0
is the reference temperture (1C is
used herein).
The tangential contact stiffness
K
s
then relates to
K
n
based on
PFC2D Guidelines (Itasca, 2004) by
K
s
= 2/3
K
n
.
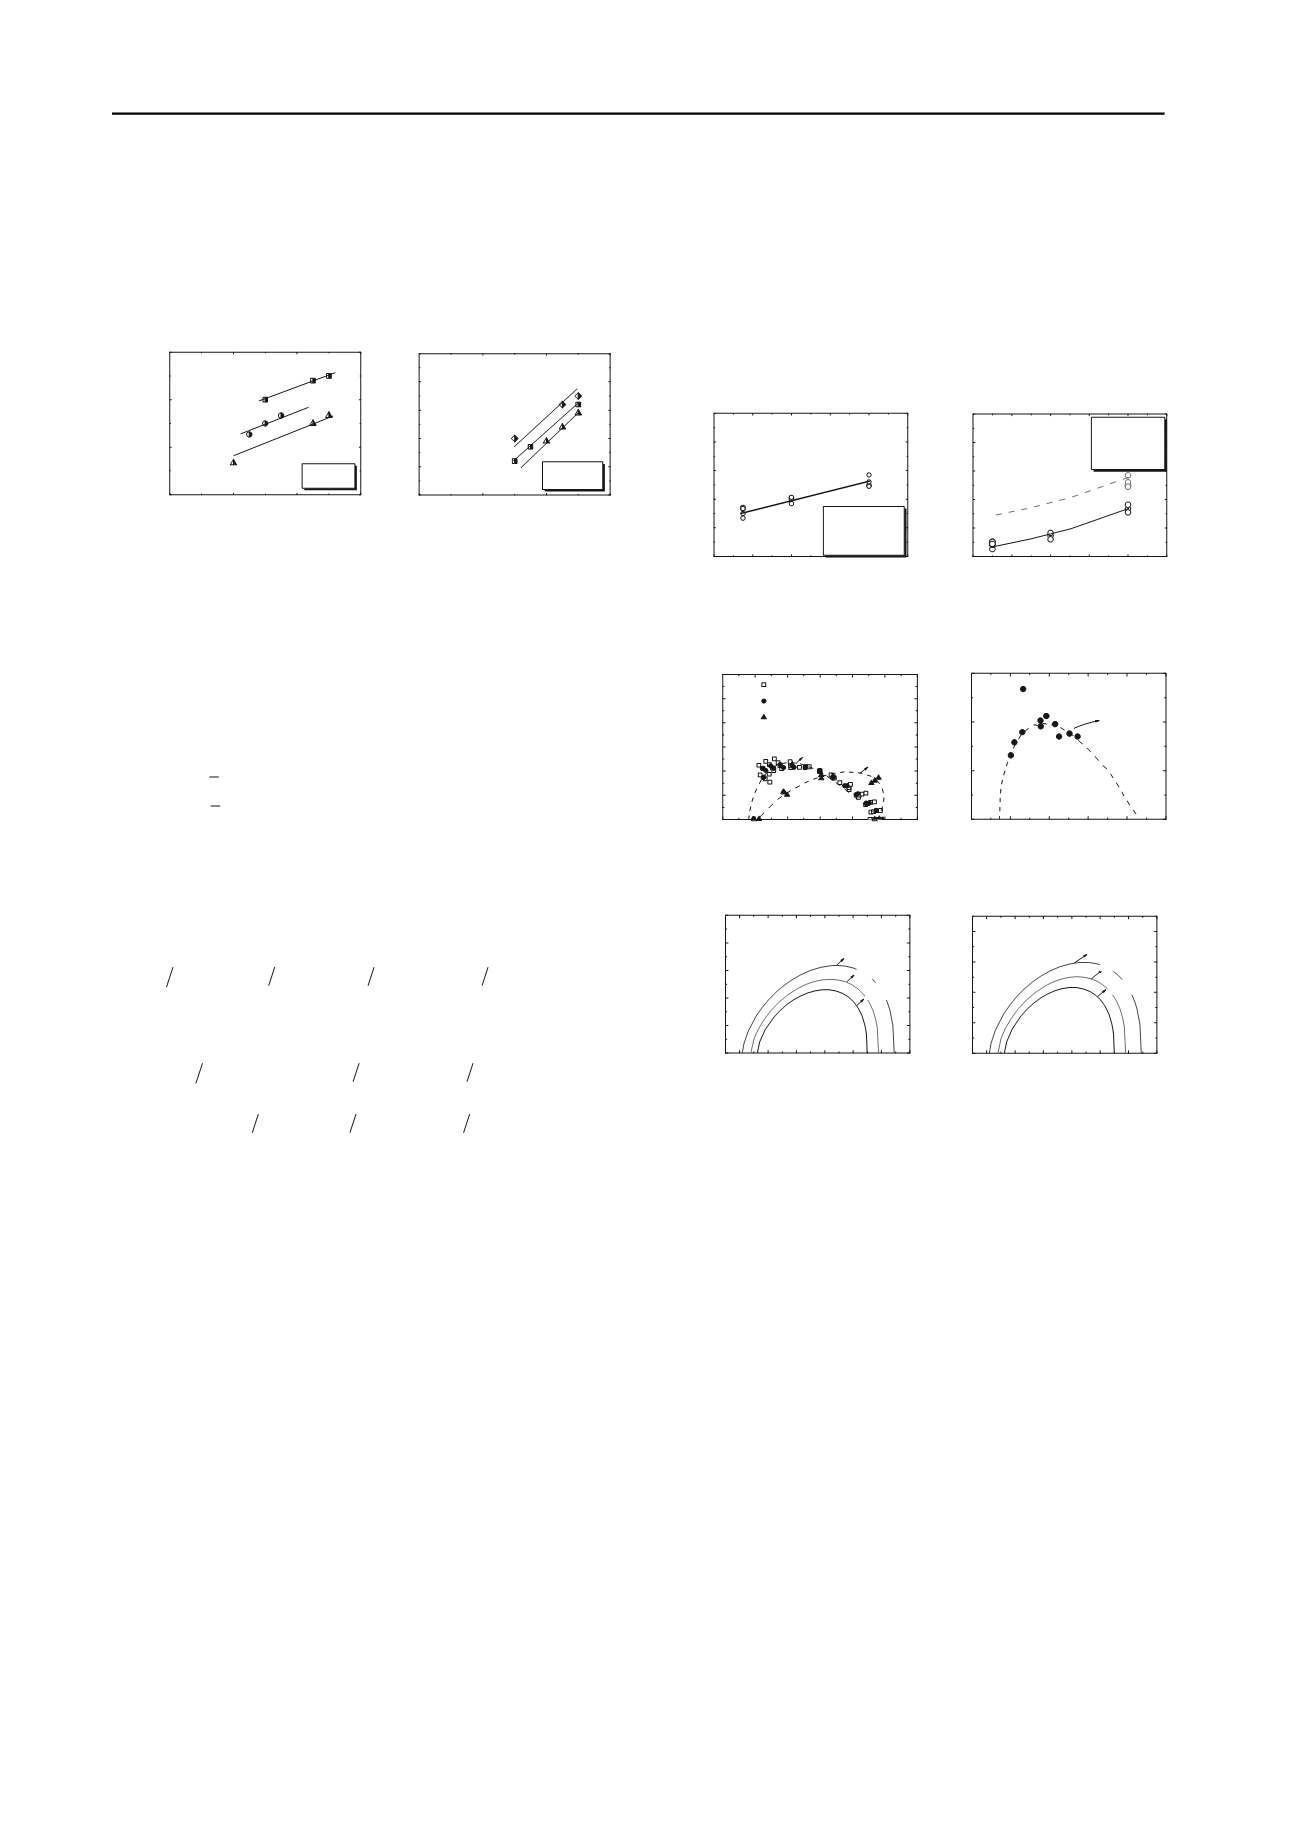
0.72
0.76
0.80
0.84
1.8
2.1
2.4
2.7
1.5MPa
4MPa
Elastic modulus
(
10
8
Pa
)
Density
g/cm
3
p
c
=8MPa
T= -30
0
C
(a)
0.72
0.76
0.80
0.84
2.2
2.3
2.4
2.5
2.6
2.7
5
0
C
-10
0
C
Elastic modulus
(
10
8
Pa
)
Density
(
g/cm
3
)
p
0
= 8MPa
T=-30
0
C
(b)
Figure 4. Elastic modulus of pure MH measured (a) at a given
temperature but varied confining pressure; and (b) at a given confining
pressure but varied temperatures (data from Hyodo et al. 2005)
2.4
Bond tension/compression strength
The bond tension and compression strength (i.e.,
R
t
and
R
c
in
Eqs. (4) and (5)) can be computed from the tension/compression
strength,
q
max
,
t
and
q
max,c
, of pure MH specimen subjected to a
given confining pressure
p
c
, i.e.,
max,
t
R Rq
t
(9a)
max,
c
R Rq
c
(9b)
As partially shown in Fig. 5, the peak deviator stress
q
max,c
obtained from the compression triaxial test on pure MH
specimens is a function of
T
,
p
c
and
(Hyodo et al. 2005). The
regression analysis of these data yields another empirical
formula:
max,
0
0.81
2.08
184.16
134.65
c a
c a
w
q p
p p
T T
(10a)
Eq. (9) is assumed to hold for tension triaxial test as well,
leading to the following:
max,
0
0.81 2.08
184.16
134.65
t
a
w
q p
p
T T
(10b)
where
0
0.55
1.15
100.09
74.39
c a
w
p
p p
T T
(11)
2.5
Fitting parameters
As already demonstrated in Fig. 2, the shape of the bond
strength envelope is controlled by the cementation materials,
resulting in different values of fitting parameters used in Eqs. (4)
and (5). Direct calibration of those parameters are rather
difficult for hydrate bonds. We assume that bond strengths are
dominated by the strength properties of cementation materials.
Fig. 6(a) shows the yielding curves of different materials. The
yielding curve is left skewed for cement-based materials and
right skewed for epoxy. Unfortunately, we are not able to
present the yielding curve for MH due to insufficiency of test
data available. As an ice-like material, MH was found similar to
ice in some physical properties (Solan et al. 1998; Dvorkin et al.
2000) and mechanical properties (Nabeshima et al. 2003; Choi
et al. 2009). Instead of MH, the yielding curve of ice is plotted
in Fig. 6(b) for comparison, which displays left skewed. We
concluded that the MH bonds produce a bond strength envelope
similar to cement bonds. The fitting parameters calibrated using
cement-bonded grains are used for MH-bonded grains. Eq. (5)
is re-written as:
0.38
1.16 0.498 (
) [(
) / (
)]
sb
n
t
c
n
n
t
R
F R R F F
0.38
R
R
(12a)
1.13 0.96 (
) [(
) / (
)]
rb
n
t
c
n
n
t
R
F R R F F
(12b)
Suppose a MHBS sample collected at 800 m below the sea
level (giving a pore water pressure of 8 MPa applied on MH
bonds in the sample) at 5C. The gradation curve of the soil
grains is assumed to be Fig. 3(b) and the initial void ratio of the
sample is 0.21. For a given
S
Hb
, the parameter
is determined
from the chart presented in Fig. 3(a).
R
t
and
R
c
computed from
Eqs. (9) to (11) are then substituted into Eq. (12) to obtain the
bond strength envelope. Fig. 7 illustrates a series of strength
envelopes at different levels of hydrate saturation. As expected,
the envelope expands omothetically with
S
Hb
.
0 2
4
6 8 10
0
5
10
15
20
25
q
max
(MPa)
Comfining pressure
p
0
(MPa)
T
= -30
℃
= 0.8g/cm
3
(a)
10 0 -10 -20 -30 -40
0
5
10
15
20
25
High purity
Low purity
q
max
(MPa)
Temperature
(
℃
)
p
0
= 8MPa
= 0.8g/cm
3
(b)
Figure 5. The maximum deviator stress of pure MH measured (a) at a
given temperature but varied confining pressure; and (b) at a given
confining pressure but varied temperatures (data from Hyodo et al. 2005)
-1.5 -1.0 -0.5 0.0 0.5 1.0 1.5
0.0
0.5
1.0
1.5
2.0
2.5
3.0
Cement-based
Epoxy resin
Hussein & Marzouk 2000
Kupfer et al., 1967
Ellyin et al., 2005
3
/
3max
(
1
-
3
)/
3max
(a)
-0.3 0.0 0.3 0.6 0.9 1.2
0.00
0.05
0.10
0.15
Nadreau & Michel 1986
3
/
3max
(
1
-
3
)/
3max
ice
(b)
Figure 6. Yielding curves obtained from experiments for: (a) cement-
based materials and epoxy resin; and (2) ice
-20 -10 0 10 20 30 40
0
5
10
15
20
25
15%
24%
S
Hb
=41%
R
sb
(
kN)
Normal force
F
n
(kN)
-20 -10 0 10 20 30 40
0
10
20
30
40
15%
24%
S
Hb
=41%
R
rb
(
N
·
m)
Normal force
F
(a)
(b)
n
(kN)
Figure 7. Bond strength envelopes at different hydrate saturation: (a)
relationship between
R
sb
and
F
n
; and (b) relationship between
R
rb
and
F
n
3 DEM SIMULATION OF BIAXIAL TESTS ON MHBS
The proposed model for MHBS was implemented into the
commercial code PFC2D for simulating the biaxial compression
test on a MHBS specimen. For inter-particle contacts with
broken bonds or without bonds,
= 0.5,
K’
n
= 3.0×10
8
N/m,
K’
s
= 2.0×10
8
N/m. The model parameters for other contacts with
intact MH bonds were determined as explained in Section 2.
A 40×80 cm virtual specimen was first generated using the
multi-layer with under-compaction method (Jiang et al. 2003).
The resulted specimen with an initial planar void ratio of 0.21
was composed of 6000 disks with radii ranging from 6 to 9 mm,
forming a gradation curve shown in Fig. 3(b). The specimen
was consolidated by applying an isotropic pressure of 1 MPa
until force balance was maintained. The gravity was ignored in
the whole simulation. Bonds were then assigned to the contacts
of particles. As the force system was balanced, the top wall
moved downward at a speed of 5% per minute to simulate the
displacement-controlled shearing process. Frictionless rigid
walls were used in the simulation in stead of flexible walls to
reduce the computational time. The boundary type selected will
not affect the stress-strain response, while it however will
change the formation of shear bands.


