 
          1025
        
        
          Technical Committee 105 /


            Comité technique 105


            Proceedings of the 18


            th


            International Conference on Soil Mechanics and Geotechnical Engineering, Paris 2013


          1) Set-up the geometry of the walls and floor of the container
        
        
          and the elements on the floor where the contact stresses
        
        
          will be monitored and the details of the trapdoor as shown
        
        
          on the left hand side Figure 1. The trapdoor is 150 mm
        
        
          long and 150 mm wide and consists of three elements 50
        
        
          mm long by 150 mm wide. The walls and floor of the
        
        
          container are assumed to be rigid.
        
        
          The normal and tangential stiffnesses between the floor
        
        
          elements and the spherical particles are the same as those
        
        
          of between the spherical elements. The friction coefficient
        
        
          between the spherical particles and the floor elements is
        
        
          0.5, which is the same as that between the particles.
        
        
          2) Generate the spherical elements above the floor in the upper
        
        
          part of the container to a depth of 150mm. Calculations
        
        
          are repeated under gravity loading until the displacement
        
        
          rates of the spheres approach zero and the bed has come
        
        
          to equilibrium. Knowing the maximum and minimum
        
        
          void ratios of Toyoura sand, the  relative density of the
        
        
          sand bed was estimated to be  86%.
        
        
          3) To simulate the trapdoor tests, the trapdoor was lowered at a
        
        
          constant displacement rate of 5mm/sec. The vertical
        
        
          stresses on the trapdoor and the floor next to the trapdoor
        
        
          were calculated.
        
        
          For the gravity flow simulations, the trapdoor was
        
        
          removed instantaneously and dynamic vertical stresses on
        
        
          the floor next to the trapdoor were calculated.
        
        
          3 RESULTS AND DISCUSSION
        
        
          First, the experimental data is compared with the DEM analysis
        
        
          data in the trapdoor tests and then the gravity flow simulation is
        
        
          discussed.
        
        
          3.1


            Trapdoor tests


          Figure 2 shows the variation of vertical stress,


            p


          , on the trapdoor
        
        
          against the downward displacement,


            d


          t
        
        
          , and on the floor
        
        
          elements adjacent to the trapdoor. The depth of the sand layer
        
        
          was 150 mm, equal to the width of the trapdoor; the initial
        
        
          vertical pressure on the floor of the container was 2.38kN/m
        
        
          2
        
        
          .
        
        
          The plots compare the experimental data obtained by Kikumoto
        
        
          et al (2003) with the calculated DEM values. The centre of
        
        
          elements A, B and C are respectively 150mm, 300mm and
        
        
          450mm from the centre of the trapdoor. It is seen that the
        
        
          vertical stress adjacent to the trapdoor is affected by the
        
        
          trapdoor movement but further away the influence of the
        
        
          movement is negligible. The vertical stress on the trapdoor
        
        
          rapidly decreased at the onset of the downward movement, and
        
        
          the experimental and DEM values corresponded well. The final
        
        
          value when


            d


          t
        
        
          = 2.0mm is 0.62kN/m
        
        
          2
        
        
          for the DEM results. On
        
        
          the other hand, the vertical stress on element A increased
        
        
          rapidly with the lowering of the trapdoor and then settles to a
        
        
          constant value of 3.0kN/m
        
        
          2
        
        
          in the DEM. The initial rate of
        
        
          increase for the vertical stress for element A in the DEM results
        
        
          is different from that of the experimental data. This reason is not
        
        
          clear, but it may be related to the difference in dilation rate
        
        
          between Toyoura sand and spherical DEM elements.
        
        
          The vertical stresses on floor elements B and C increased
        
        
          slightly and there is good agreement between the experimental
        
        
          data and the calculated DEM results.
        
        
          Figure 3 shows the distribution of vertical stress laterally
        
        
          from the centre of the trapdoor when


            d


            t


          = 2.0mm. The vertical
        
        
          stress on the trapdoor decreased and increased on the floor next
        
        
          to the trapdoor. The DEM data show a sawtooth distribution not
        
        
          seen in the experimental data.
        
        
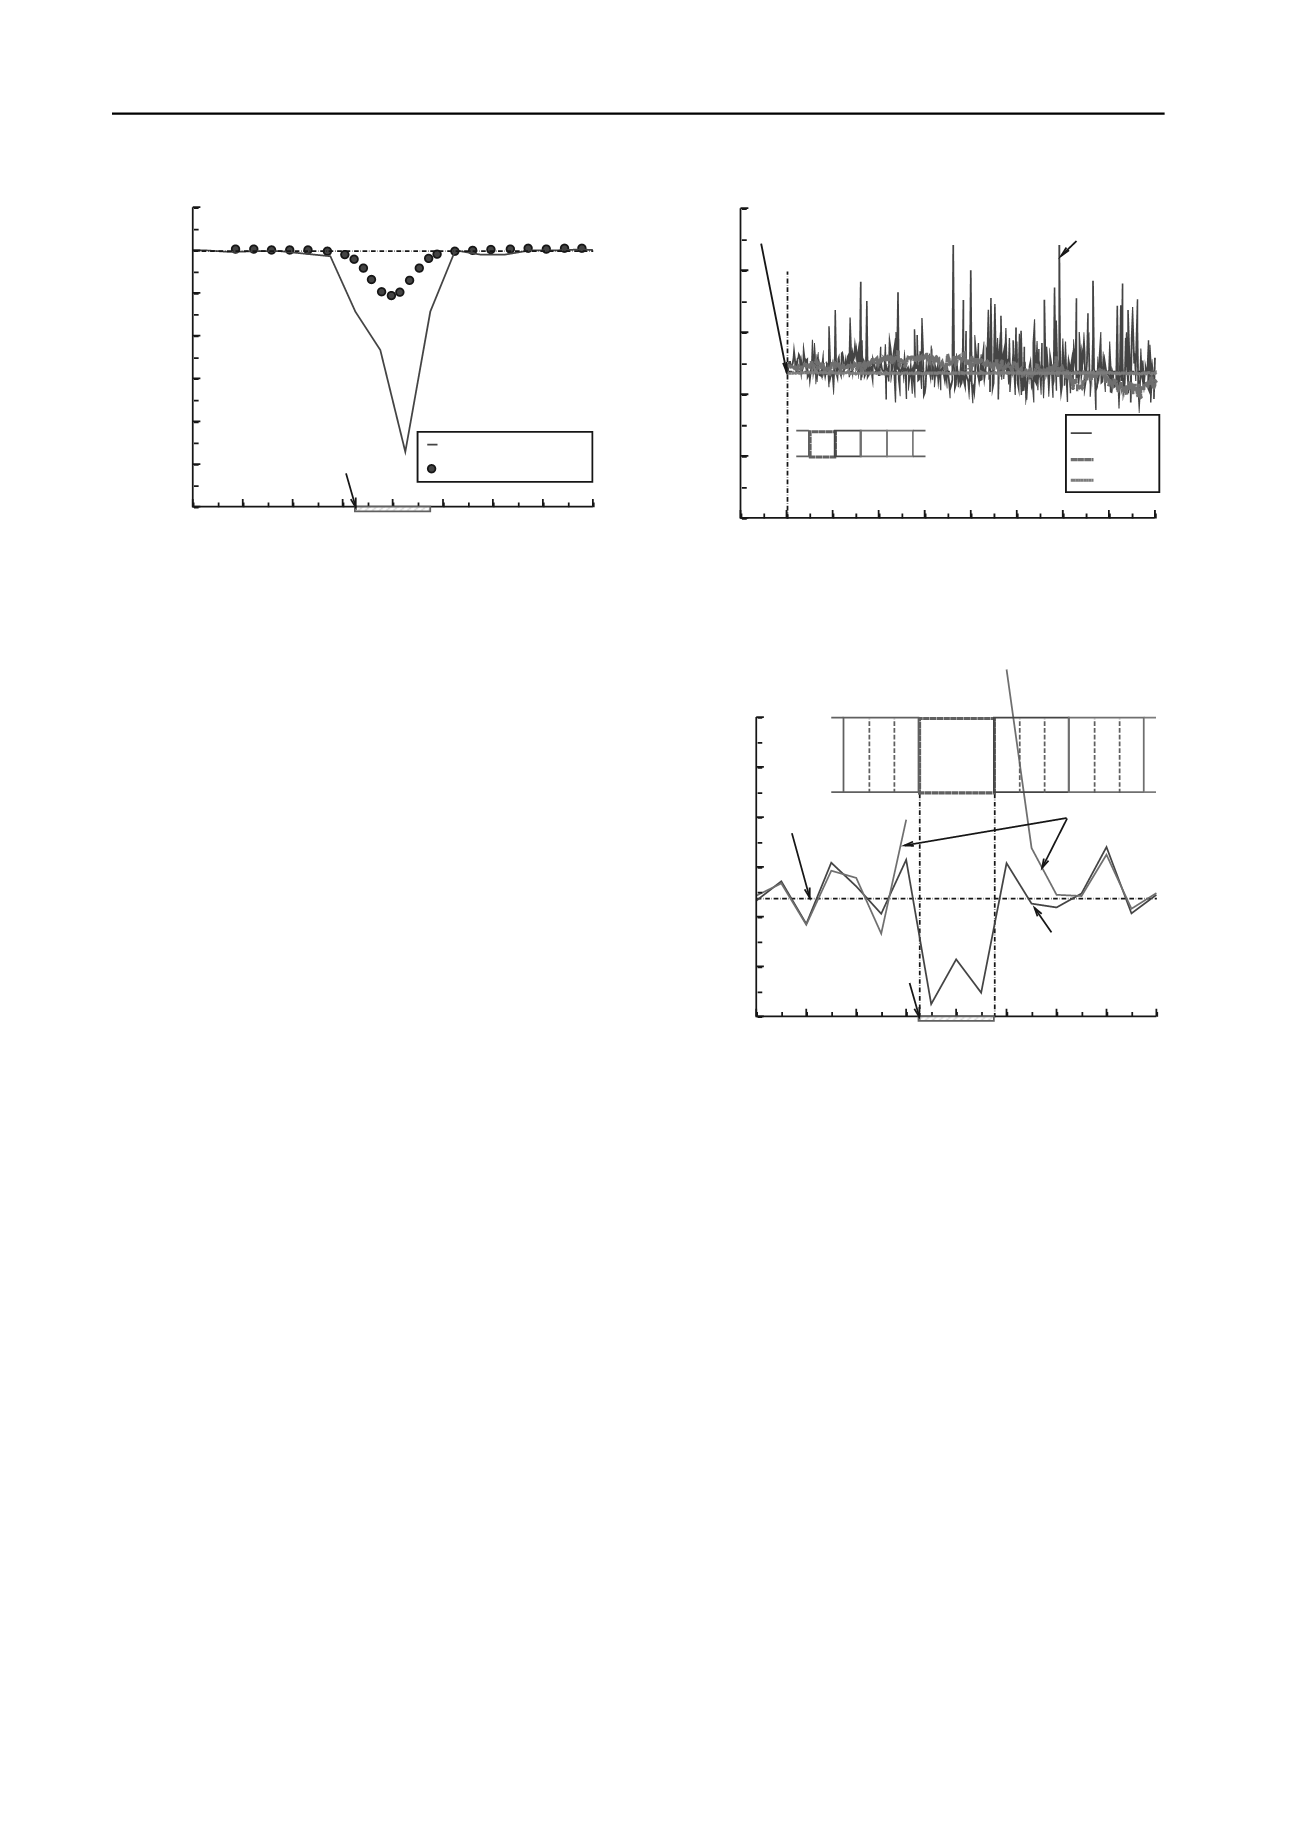
          Figure 4 shows the surface settlement of the sand above the
        
        
          centre of the trapdoor when


            d


          t
        
        
          = 2.0mm at the depth of the sand
        
        
          layer was 150 mm. The experimental data was measured by the
        
        
          laser displacement scanner which accuracy was 1


          m (Kikumoto
        
        
          et al. 2003). It is, however, Figure 4 that reveals the most
        
        
          significant shortcoming of the DEM modelling as the
        
        
          experimental and calculated subsidence trough at the upper
        
        
          surface of the sand are very different; the surface settlement in
        
        
          -400 -300 -200 -100 0 100 200 300 400
        
        
          0
        
        
          1
        
        
          2
        
        
          3
        
        
          4
        
        
          5
        
        
          6
        
        
          Earth pressure,


            p


          (kN/m
        
        
          2
        
        
          )
        
        
          Horizontal distance from the centre of trapdoor,


            h


          d
        
        
          (mm)


            DEM (trapdoor)


            DEM


            (gravity flow)


            gravity flow


            initial earth pressure


            (=2.38kPa)


            trapdoor


              t


            =0.3sec


          Figure 4. Surface settlement of the sand above the centre of the
        
        
          trapdoor when


            d


            t


          = 2.0mm, layer thickness 150 mm.
        
        
          Figure 5. Vertical stress on the floor next to the trapdoor during
        
        
          gravity flow.
        
        
          Figure 6. Comparison of vertical stress distributions on the floor
        
        
          next to the trapdoor during trapdoor lowering and during gravity
        
        
          flow at the elapsed time of 0.3sec.
        
        
          -0.05 0.00 0.05 0.10 0.15 0.20 0.25 0.30 0.35 0.40
        
        
          0
        
        
          1
        
        
          2
        
        
          3
        
        
          4
        
        
          5
        
        
          Earth pressure,


            p


          (kN/m
        
        
          2
        
        
          )
        
        
          Elapsed time after the trapdoor deleted,


            t


          (sec)


            C (DEM)


            B (DEM)


            A (DEM)


            gravity flow


            A B C


            initial earth pressure 2.38kPa


              t


            =0.3sec


          -400 -300 -200 -100 0 100 200 300 400
        
        
          3.0
        
        
          2.5
        
        
          2.0
        
        
          1.5
        
        
          1.0
        
        
          0.5
        
        
          0.0
        
        
          -0.5
        
        
          Surface settlement,


            s


          s
        
        
          (mm)
        
        
          Horizontal distance from the centre of trapdoor,


            h


          d
        
        
          (mm)


            Kikumoto et al. 2003


            DEM


            trapdoor