1033
Technical Committee 105 /
Comité technique 105
in the work by Santamarina (2001). This phenomenon was also
reported by Yang and Gu (2012) in their experimental study.
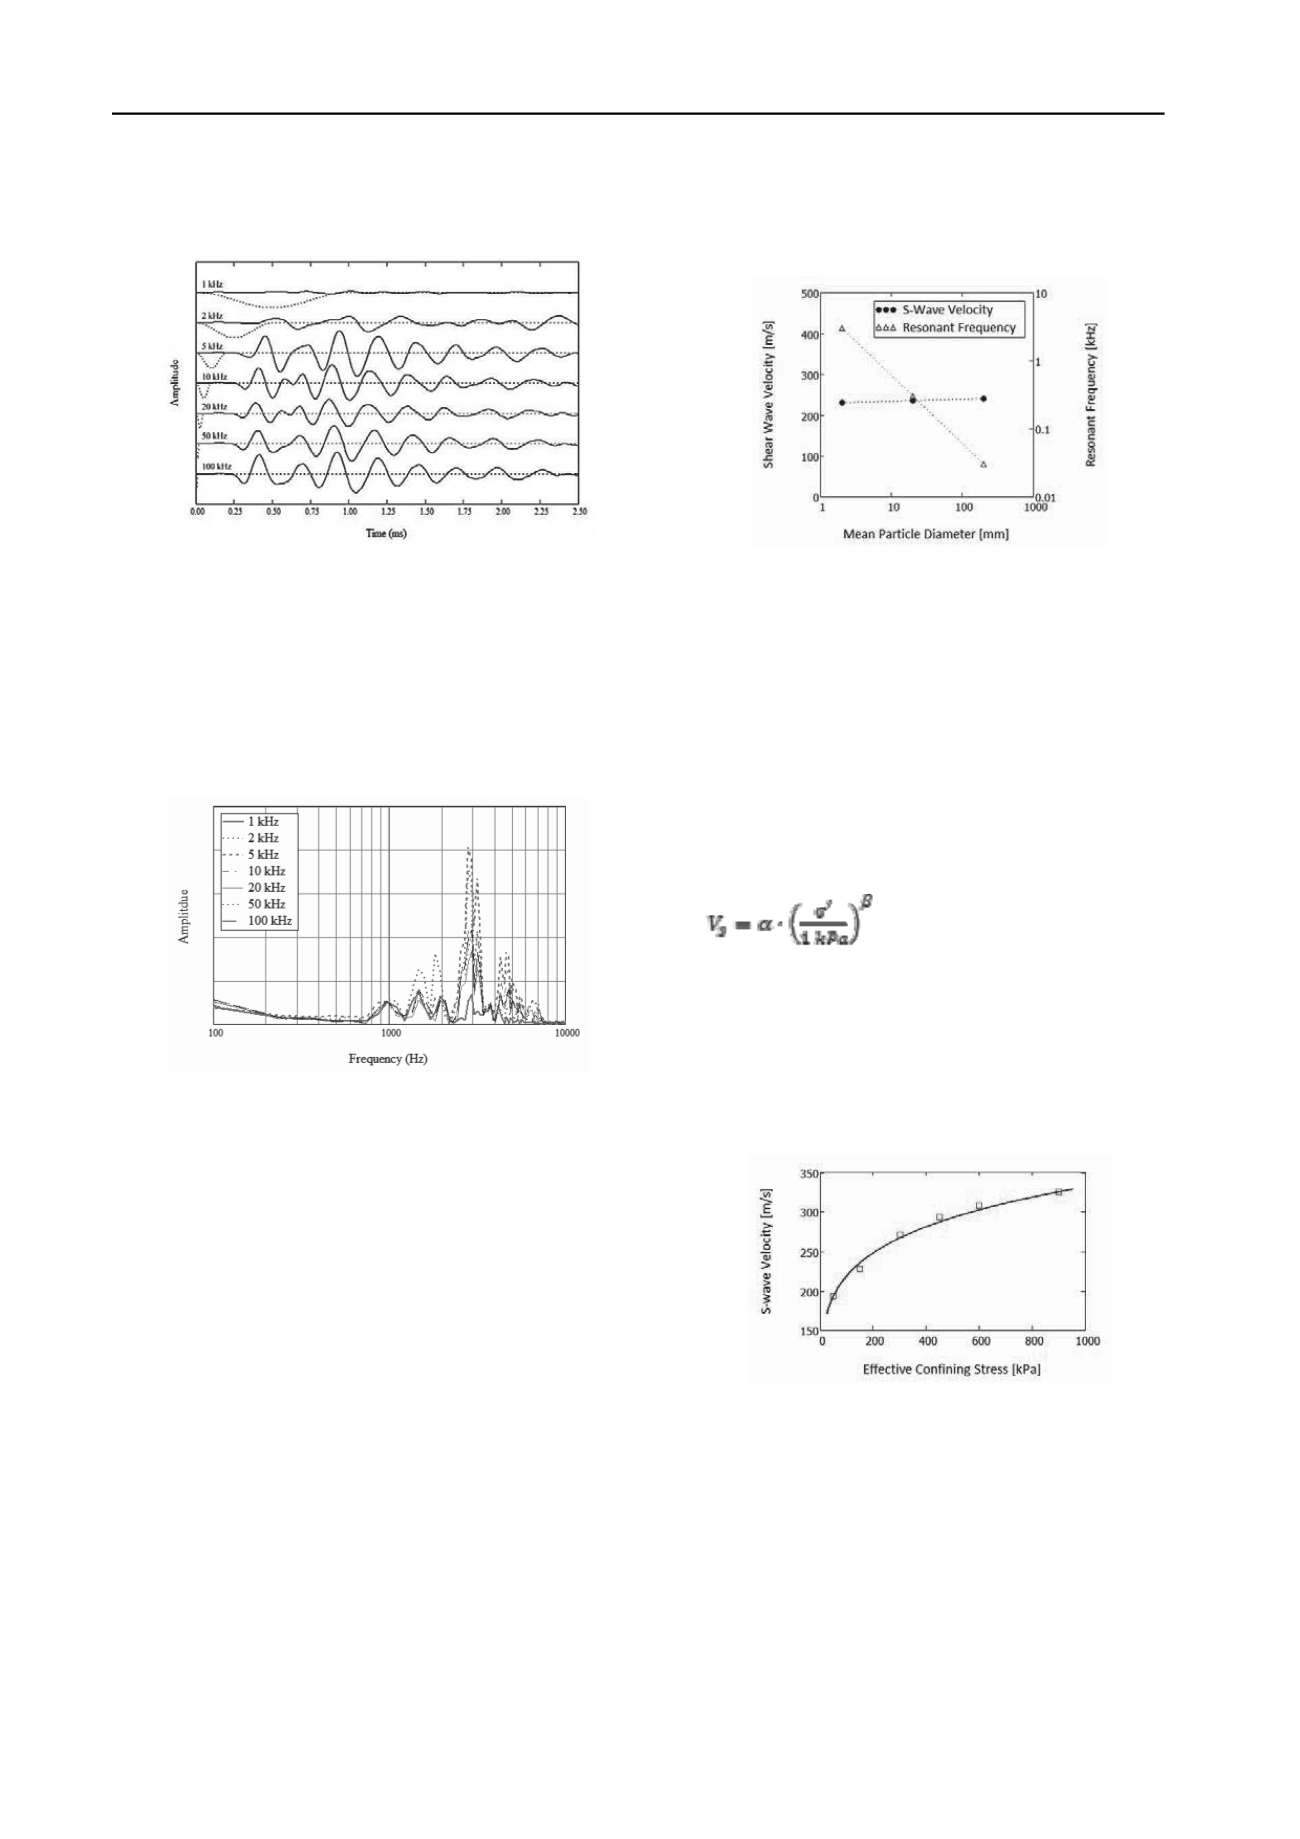
Figure 3. Response of a receiver in the time domain, excited by a sine
pulse with different frequencies (D
50
= 2.0 mm; e = 0.63; σ'
3
= 150 kPa.
Note: for clarity, the scale of the magnitude for the source signal and the
receiving signals are different)
Because the materials with internal spatial scales are
inherently dispersive (Santamarina 2001), wave propagation
velocity varies with frequency in granular soils. There are
experimental studies (Blewett et al. 2000; Styler and Howie
2012) showing frequency-dependent S-wave velocity responses.
In the 2D DEM simulation by O’Donovan et al. (2012), the S-
wave velocity increases linearly with the transmitted frequency.
Figure 4. Response of receiver in frequency domain, excited by sine
pulse with different frequencies (D
50
= 2.0 mm; e = 0.63;
σ'
3
= 150 kPa)
.
Figure 3 shows that the variation of the first arrival of the S-
wave can be observed, though it is not obvious. The S-wave
velocity increases slightly (from 220 m/s to 231 m/s) when the
transmitted frequency increases from 1 kHz to 5 kHz. This is
attributed to the viscous damping effect at the inter-particle
contacts (O’Donovan et al. 2012). When the transmitted
frequency is higher than the resonant frequency, the variation of
S-wave velocity becomes even less appreciable (a consequence
explained by the aforementioned low-pass filter effect).
4 PARTICLE SIZE AND CONFINING STRESS EFFECTS
The effect of particle size on S-wave velocity has been widely
studied by using bender element tests. A recent work by Yang
and Gu (2012) found controversial results by comparing many
previous researches. DEM simulation allows for the study of
particle size effect with a much larger size range than physical
test does. Knowing the particle size effects on wave propagation
problem is also important for DEM simulation to determine
whether the mass-scaling (O'Sullivan, 2011) is applicable.
Three mean particle sizes were considered (2 mm, 20 mm, 200
mm). Since wave propagation involves high frequency effects,
different responses are expected from models with different
particle sizes. Figure 5 shows the effects of particle size on S-
wave velocity and resonant frequency. There was little change
in S-wave velocity over three orders of magnitude in particle
size. This agrees with Yang and Gu (2012), who found that S-
wave is effectively size independent. Regarding the resonant
frequency of model, a linearly decreasing trend with the particle
size was observed.
Figure 5. Effects of particle size on S-wave velocity and resonant
frequency (D
50
= 2 mm, 20 mm, 200 mm; e = 0.62–0.63; σ'
3
= 150 kPa)
These results indicate that mass-scaling (e.g. by manipulating
the particle size; Evans and Frost 2007, Jacobson et al. 2007,
Belheine et el. 2010) can be applied to reduce computing time
in DEM simulations of S-wave propagation. The excitation
frequency should be carefully selected near the resonant
frequency (a function of the particle size) to obtain strong
frequency response in the model.
Stress state affects interparticle stiffness (Santamarina 2001)
and, perhaps more significantly, contact quality (Evans et al.
2011) and thus, wave propagation speed. Many empirical
relationships between S-wave velocity and effective confining
stress have been proposed (Hardin and Richart 1963) for sands.
One general form is as follows:
(1)
where
α
and
β
are fitting parameters and
σ'
is the effective
confining stress in kPa.
In this study, the S-wave velocities of a DEM specimen with
D
50
= 2.0 mm were determined under confining stresses ranging
from 50 to 900 kPa. The simulation results present a similar
trend as observed in the lab as shown in Figure 6. The fitting
parameters
α
and
β
were found to be 95.5 and 0.18 respectively,
which fall into the range of typical values for sand and OC clay
(Fernandez 2000)
Figure 6. Effects of confining stress on S-wave velocity (D
50
= 2.0 mm;
e = 0.62-0.63)
5 MICROMECHANICAL OBSERVATIONS
In laboratory tests, it is not possible to directly observe complex
wave motions within the specimen. DEM simulations allow for
micromechanical predictions of material response, which can
help to provide a better understand of the complexity of wave
propagation mechanisms in granular materials. Observations of
the particle velocity vectors are briefly considered below.
Figure 7 shows particle velocity vectors on three specific
cutting planes of a DEM specimen 10 ms after excitation. The
cutting plane on the left goes through the central axis of the
specimen with its normal parallel to Y-axis. The cutting plane
1-1 and the cutting plane 2-2 are at the height of two receivers
respectively with their normal parallel to Z-axis. The particle


