1041
Technical Committee 105 /
Comité technique 105
a
b
Figure 2. Drainage-type snap-off in a doublet. (a) Displacing fluid
(green) is non-wetting and displaced fluid (red) is wetting. (b)
Displacing fluid is wetting and displaced fluid is non-wetting
.
The properties of the pair of the tested fluids are presented in
Table 1. The simulations were carried out in a two-dimensional
medium similar to the chamber-and-throat type networks used
in the experiments (see Figure 3). It should be mentioned that
the dimensions of the model could not be considered as large as
that of the experiment due to high computational costs.
Table 1.Physicochemical properties of fluids
Non-wetting fluid
(n-nonanol)
Wetting fluid
(formamide)
Viscosity(Pa s)
0.00964
0.00335
Density(kg/
)
816
1116
Interfacial tension(mN/m)
4.3
Contact angle
9
a
b
Figure 3. (a) A segment of the glass-etched chamber-and-throat network
used in experiments (b) domain used in LB simulation.
At first, the saturated permeability of the medium was
determined by the numerical modeling for a steady-state
Darcy’s velocity after applying a constant body force for one
phase and setting the density of the other fluid equal to zero at
all locations. The result was
k = 8.82μm
2
which is remarkably
close to the experimental value of 8.9
μm
2
It is important to
note that the employed MRT approach in the developed LBM
code has yielded more accurate predictions of both saturated as
well as relative permeabilities compare to the standard BGK
model, which leads to a viscosity dependent permeability.
4.1
Steady state
To simulate the steady-state experiments, we distributed fluid
phases in the model according to target saturation. Flow at a
given
Ca is
then commenced.
(2)
Where
is the superficial flow velocity of the injected
wetting phase at the entrance,
is the viscosityof the wetting
phase, is the interfacial tension.
We imposed periodic boundary conditions and allowed both
fluids to enter and exit the model. Phase saturations were thus
constant during the simulations. We applied the same body
force to each phase, thus the global pressure drop was the same
for both fluids. This eliminated the capillary end effects since
there were no gradients in capillary pressures.
The two immiscible fluids flow until the relative
permeabilities and the pressure drop have converged. When the
system has converged and steady-state flow is established, the
steady-state relative permeability of two fluids from a
verage
flow fluxes of the wetting and non-wetting fluids are calculated
at several sections along the direction of the flow in the domain.
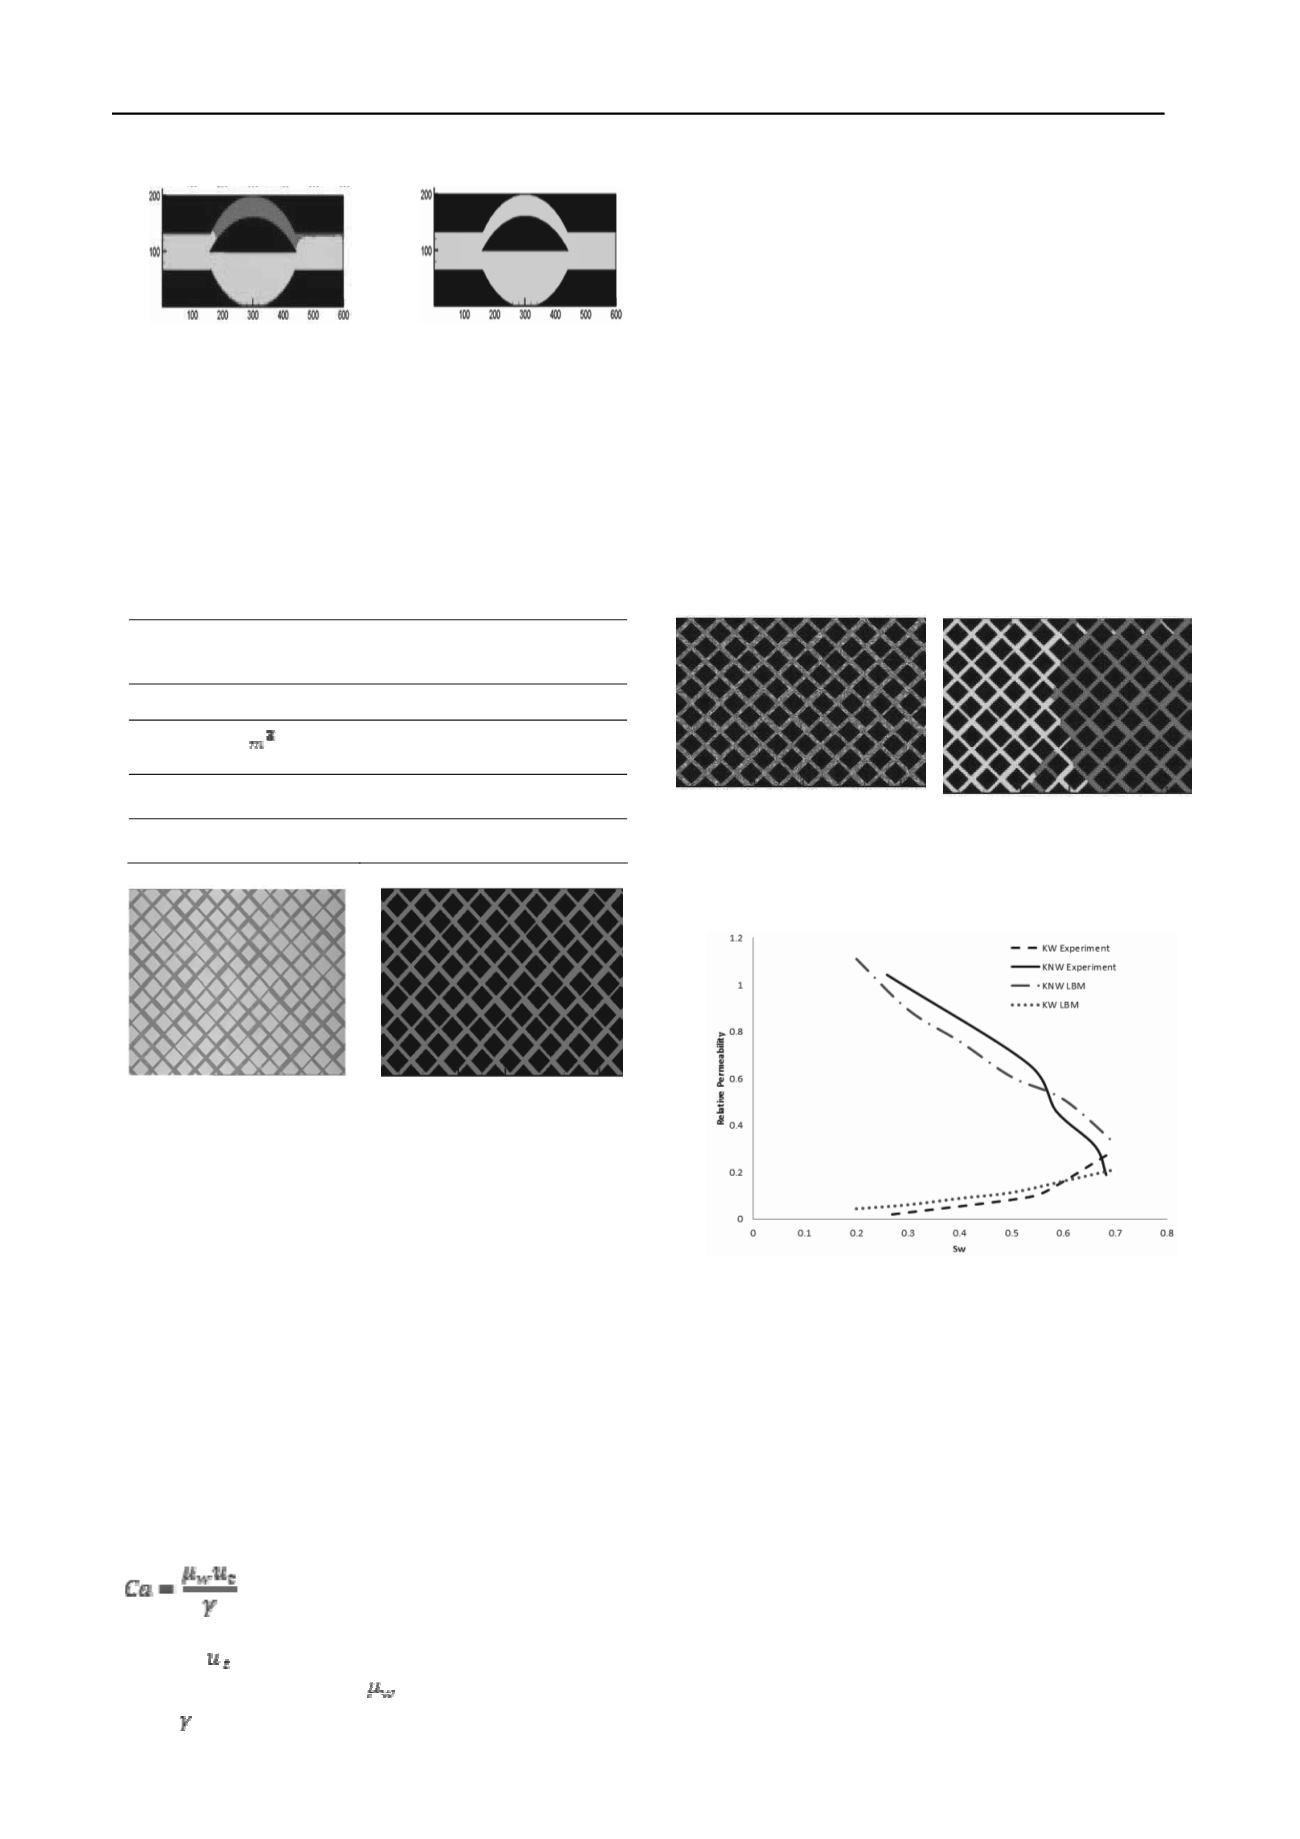
Figure 4a shows an example of the initial distribution of the
fluids in the domain and Figure5shows the experimental relative
permeability curve as well as the results of LB simulation
performed at a similar capillary number. According to Figure
5the numerical results are in relatively good agreement with
experimental measurements.
a
b
Figure 4. (a)
example of initial distribution of the fluids in steady-
state simulation (b) example of invasion of wetting fluid(green)
in unsteady state simulation.
Figure 5.Comparison of LB modeling results and experimental relative
permeability curves (steady state)
(Ca=5E-6).
4.2
Unsteady state
The unsteady-state method is widely used because it is fast and
qualitatively resembles the flooding process in the oil reservoir.
However, it is an indirect method. Relative permeabilities are
calculated, not measured. Typically, the Johnson, Bossler and
Naumann (JBN) method (
Johnson et al. 1959
) or its variants are
used to calculate relative permeabilities from the measured
production data and pressure drop. This method is based on the
assumptions that the flow velocity is high enough thereby
making capillary end effects negligible and that the flow
velocity is constant. In addition, the flow components should
behave as immiscible and incompressible fluids comprising a
stable displacement.
Numerical simulation of the variation of relative permeabilities
under unsteady- state situation is a difficult task that has not
been performed before. Here, by using the developed LBM
code and employing MRT technique an attempt has been made


