1038
Proceedings of the 18
th
International Conference on Soil Mechanics and Geotechnical Engineering, Paris 2013
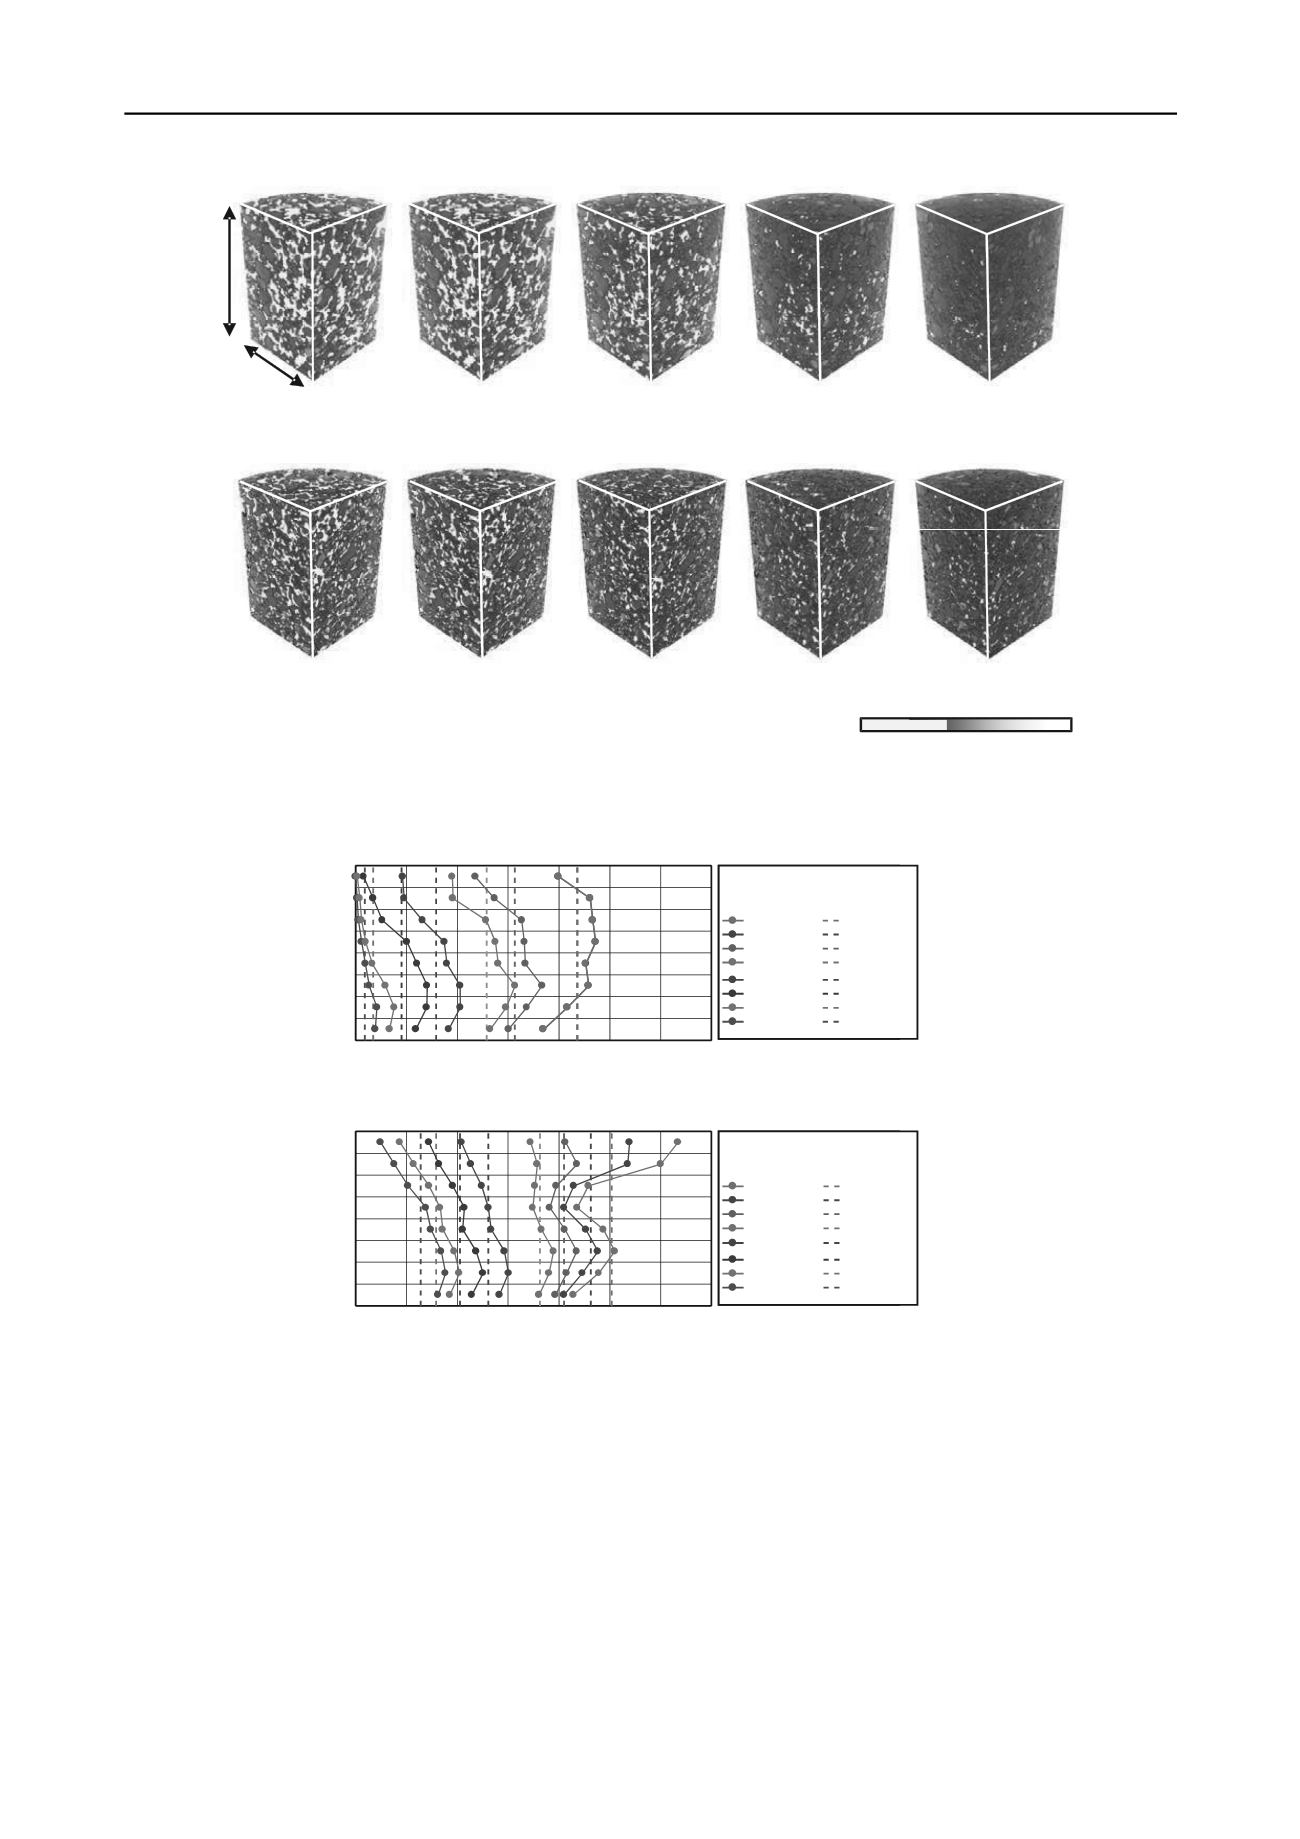
0
80
240
CT-value
initial
Level A
Level C
Level E
Level G
40mm
25mm
(a) Case-1
(b) Case-2
initial
Level A
Level C
Level E
Level G
Figure 6. Spatial distribution of porosity in the soil.
6 REFERENCES
Dempster, A.P., Laird, N.M. and Rubin, D.B. 1977. Maximum
likelihood from incomplete data via the EM algorithm.
Journal of
the Royal Statistical Society
, Series B: Methodological, 39, 1-38.
Higo Y., Oka F., Kimoto S., Sanagawa T. and Matsushima Y. 2011.
Study of strain localization and microstructural changes in partially
saturated sand during triaxial tests using microfocus X-ray CT,
Soils and Foundations
, 51(1), 95-111.
Otani J., Mukunoki T. and Obara Y. 2000. Application of X-ray CT
method for characterization of failure in soils,
Soils and
Foundations
, 40(2), 111-118.
Otani J.
2003. State of the art report on geotechnical X-ray CT research
at Kumamoto University, Keynote Lecture,
X-ray CT for
Geomaterials
, Balkema, 43-77.
Watanabe Y., Lenoir, N., Otani J. and Nakai T. 2012. Displacement in
sand under triaxial compression by tracking soil particles on X-ray
CT data,
Soils and Foundations
, 52(2), 312-320.
0 5 10 15 20 25 30 35
20
30
40
50
Porosity (%)
Distance from the bottom
(mm)
Air contents
initial
Level A
Level B
Level C
Level D
Level E
Level F
Level G
(a) 5mm each (b) Average
initial
Level A
Level B
Level C
Level D
Level E
Level F
Level G
0 5 10 15 20 25 30 35
20
30
40
50
Porosity (%)
Distance from the bottom
(mm)
initial
Level A
Level B
Level C
Level D
Level E
Level F
Level G
(a) 5mm each (b) Average
initial
Level A
Level B
Level C
Level D
Level E
Level F
Level G
Air contents
(a) Case-1
(b) Case-2
Figure 7. Distribution of porosity in the soil.


