1037
Technical Committee 105 /
Comité technique 105
with its iteration process has to be conducted in order to obtain
the optimum threshold value.
4 RESULTS AND DISCUSSION
4.1
CT images
First of all, the obtained threshold value was checked with the
measurement of the volume of the voids in the soil. Figure 4
shows the changes of the porosity due to the increase of
compaction energy for both cases and the results of the analysis
using the obtained threshold values were compared with the
measurement results. As easily realized from this figure, both
results are fairly close and thus, it can be said that the obtained
threshold value can be effective for this study. And it is also
concluded that the porosity decreases with the increase of the
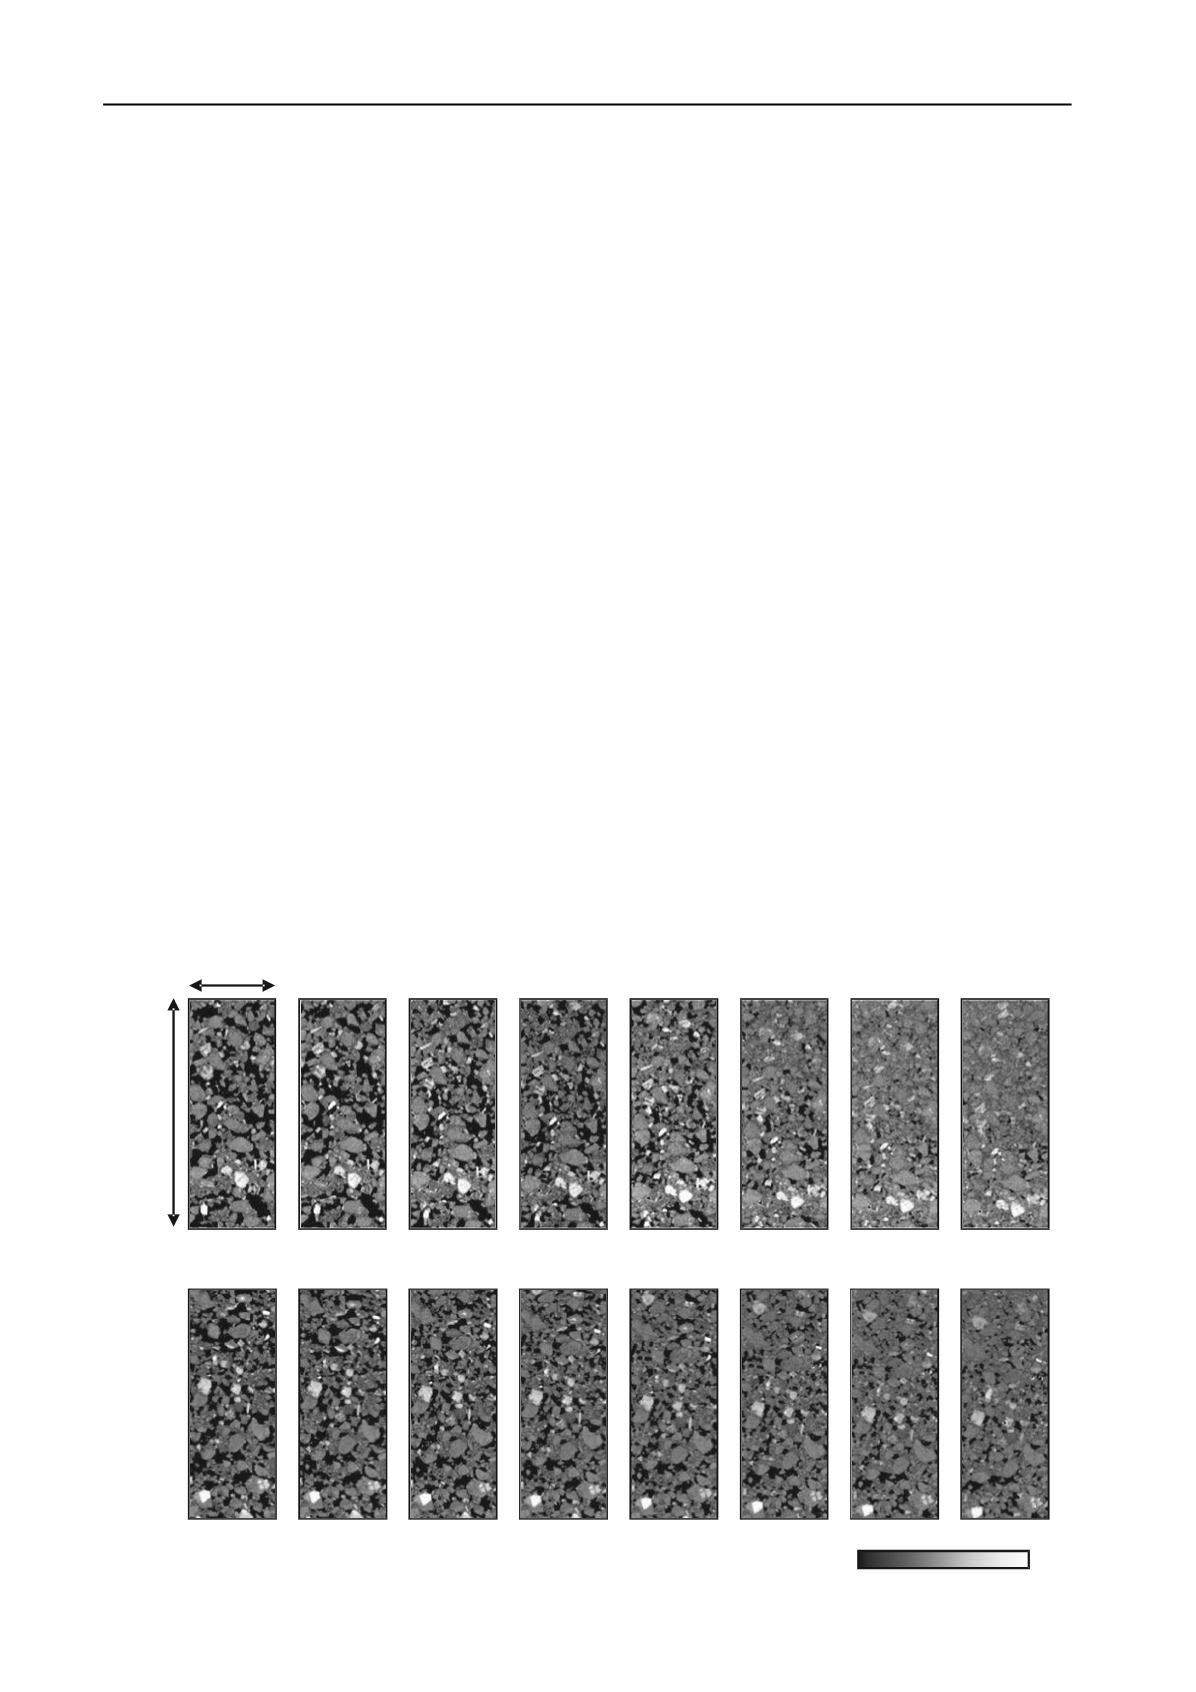
compaction energy. Figure 5 shows the vertical cross-sectional
CT images for both cases from initial to the end of compaction
level (Level G). In the CT images, the color of black indicates
the area of low density while that of white shows the area of
high density with total of 256 levels. It is obvious that the area
of the voids decreases with increase of compaction energy for
both cases. And the movement of each soil particle is integrated
around the top of the specimen for both cases. Looking at the
degree of compaction shown in Table 2, the Level D shows
already more than 90% of compaction but there are still some
areas of black color. Thus, it is concluded that average value of
compaction degree, 90% has still many voids in the compacted
soil.
4.2
Spatial distribution of air voids
Figure 6 shows the spatial distribution of air voids in the soil in
three dimensions using the results of CT scanning. The areas of
light color show those of the voids. As easily realized from
those images, the more the compaction energy is the more the
porosity decreases. And when Case-1 and Case-2 are compared,
it is obviously said that the porosity for Case-2 is more than that
of Case-1. Especially, it is realized that the distribution of
porosity in the soil is somehow different between two cases.
Figure 7 shows the distribution of porosity in the soil for both
cases, in which the porosity of every 5mm depth was plotted
with the average values as dotted lines. As realized from those
figures, it is concluded that the compaction for Case-1 which is
higher energy for one cycle of compaction is more effective
than that of Case-2 and especially, for Case-2, it can be realized
that there are not enough compaction areas around the bottom of
the soils. This means that the way of compaction changes the
effectiveness of the compaction.
5 CONCLUSIONS
The main purpose of this study was to develop a new method of
compaction control for riverbank. Here in this paper, micro
level of the mechanism on compacted sandy soil was discussed
using micro-focus X-ray CT. The conclusions drawn from this
discussion are summarized as follows:
(1) Based on three dimensional visualization of the compacted
soil using micro-focus X-ray CT, it has been found that the
soils with 90% of average compaction degree still have
some degree of the voids left; and
(2) According to the results of comparison on different
compaction energy, the case of higher energy for one cycle
has better compaction capacity and this was proved by the
spatial distribution of the porosity in the soil.
Finally, although those findings were rather fundamental,
more quantitative discussion will be continued using special
image analysis such as Digital Image Correlation (DIC) method.
15 mm
(1) Case-1
(a) initial
(b) Level A
Figure 5. Vertical cross sectional images.
CT-value
Low
High
40 mm
(c) Level B (d) Level C (e) Level D (f) Level E (g) Level F (h) Level G
(a) initial
(b) Level A (c) Level B (d) Level C (e) Level D (f) Level E (g) Level F (h) Level G
(2) Case-2


