1024
Proceedings of the 18
th
International Conference on Soil Mechanics and Geotechnical Engineering, Paris 2013
Proceedings of the 18
th
International Conference on Soil Mechanics and Geotechnical Engineering, Paris 2013
In this study, we used a 3D particle flow code (PFC3D,
Itasca 2012) to perform discrete element (DEM) simulations of
the trapdoor experiments reported by Kikumoto & Kishida 2003,
Kikumoto et al. 2003. In this work a bed of Toyoura sand
75~300 mm deep was placed by air pluviation into a box one
metre square. The relative density of Toyoura sand achieved by
this method was about
D
r
= 88%. Along the middle floor of the
box, an instrumented strip 150 mm wide had been installed so
that the vertical stress distribution could be measured. One part
of this strip formed the trapdoor which could be moved
downwards in a controlled manner or removed. With this
arrangement the vertical stresses on the trapdoor and the floor of
the container adjacent to the trapdoor could be monitored. These
details are shown in the left hand side of Figure 1.
The first part of the DEM simulation calculated the vertical
stress on the trapdoor and floor of the box as the trapdoor was
moved downwards at a constant rate. In the second part of the
simulation the vertical stresses on the floor of the container
were calculated during gravity flow of the sand from the
container after the sudden removal of the trapdoor.
2 OUTLINE OF DEM MODELLING OF THE TRAPDOOR
AND GRAVITY FLOW TESTS
2.1
Three-dimensional Trapdoor and Gravity Flow Tests
The right hand side of Figure 1 shows the configuration of the
DEM model. The dimensions of the soil container are almost
the same as the experimental testing apparatus used by
Kikumoto & Kishida 2003, except the depth of the sand layer is
150 mm whilst Kikumoto et al used various depths between 75
and 300 mm.
2.2
DEM analysis
Kikumoto & Kishida 2003 used Toyoura sand (
D
50
= 0.20mm at
D
r
= 88%) in the experimental trapdoor tests. For the DEM
analysis it is difficult to simulate the grain size distribution,
particle shapes, and other properties of the sand. In this study,
we used spherical particles for the DEM analysis, and calculated
the normal and tangential stiffness coefficients,
k
n
,
k
s
, using P-
and S-wave velocities that had been measured for Toyoura sand
by Hori et al 2010. The stiffness coefficients are obtained from:
3
2
p s
n
VR
k
(1)
3
2
s s
s
VR k
(2)
where:
V
p
and
V
s
are respectively the P- and S-wave velocities
of the granular medium ,
R
is the average of sphere radius,
s
is
the density of spherical particles. It is known that both normal
and tangential interparticle stiffnesses may be functions of both
wave velocities, but equations (1) and (2) assume that the
normal stiffness depends only on
V
p
and the tangential
stiffness only on
V
s
. Values for
V
p
and
V
s
of Toyoura sand of
403 and 254 m/sec respectively were obtained by Hori et al
2010 using the bender and extender element tests; thus
k
n
and
k
s
were calculated to be 4.7
10
6
and 1.9
10
6
N/m, respectively.
Table 1 shows the DEM parameters used in this study.
Table 1. DEM parameters used in this study
Parameter
Symbol
Value
Unit
Density of sphere
s
2650
kg/m
3
Mean radius of sphere
R
10.5
mm
Ratio of maximum and
minimum radius of sphere
R
max
/
R
min
2.0
-
Normal stiffness
k
n
4.7
10
6
N/m
Tangential stiffness
k
s
1.9
10
6
N/m
Friction coefficient
0.5
-
Critical damping ratios
n
s
0.8
-
2.3
DEM procedure for trapdoor and gravity flow tests
The DEM procedures for the trapdoor and gravity flow tests are
as follows:
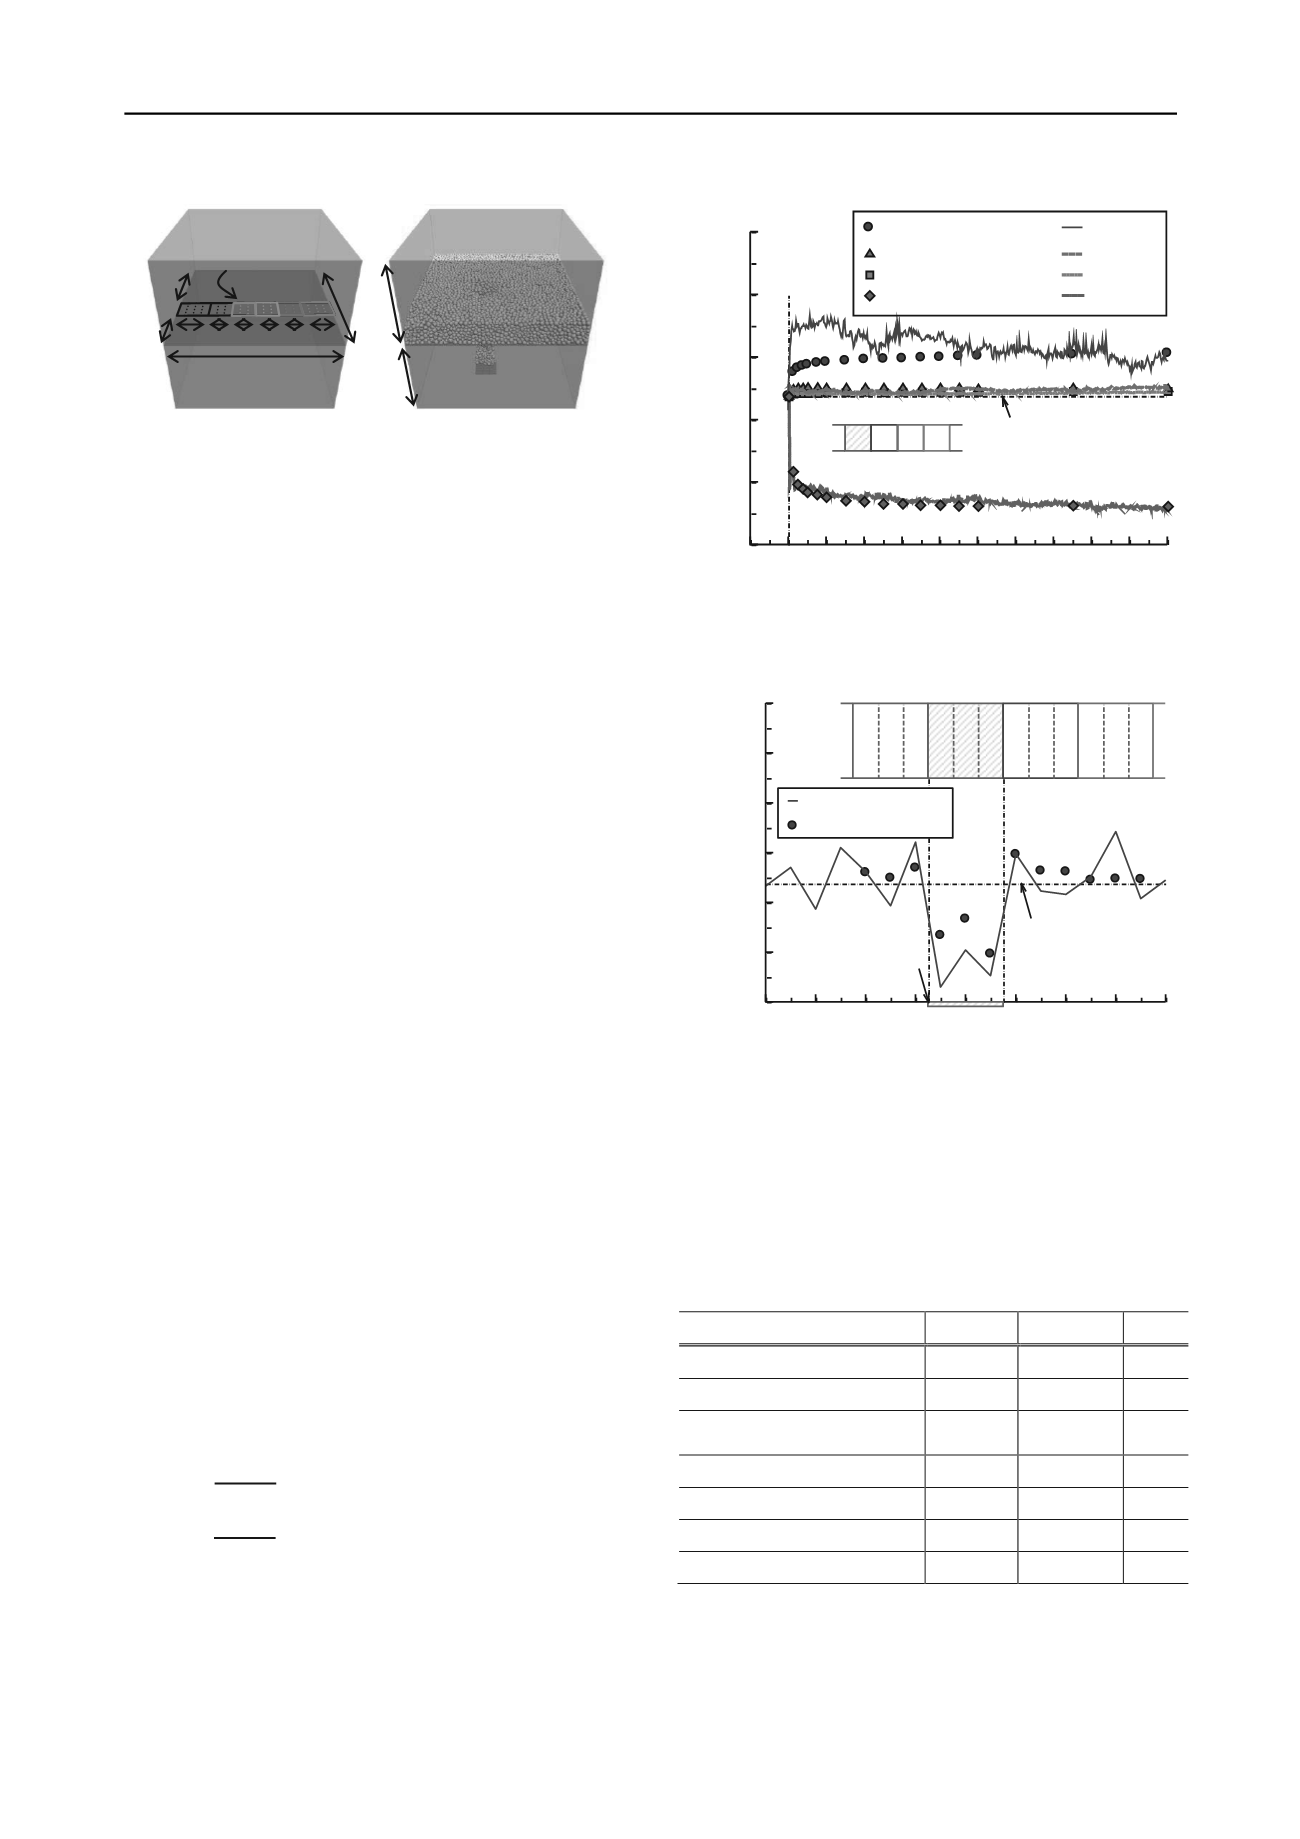
Figure 1. Trap door and gravity flow testing apparatus (left), and
DEM simulation (right).
Figure 2. Vertical stresses on the trapdoor and the floor next to
the trapdoor against trapdoor displacement.
Figure 3. Experimental and DEM distributions of vertical stress at
a trapdoor displacement of 2.0mm, with an overburden depth of
150 mm.
-0.2 0.0 0.2 0.4 0.6 0.8 1.0 1.2 1.4 1.6 1.8 2.0
0
1
2
3
4
5
Earth pressure,
p
(kN/m
2
)
Displacement of trapdoor,
d
t
(mm)
trapdoor
(Kikumoto et al. 2003)
C (Kikumoto et al. 2003)
B (Kikumoto et al. 2003)
A (Kikumoto et al. 2003)
trapdoor
(DEM)
C (DEM)
B (DEM)
A (DEM)
trapdoor
A B C
initial earth pressure
(=2.38kPa)
1000
unit: mm
1000
150 150 150 150 200
200
300
150
550
500
500
trapdoor
A B C
-400 -300 -200 -100 0 100 200 300 400
0
1
2
3
4
5
6
Earth pressure,
p
(kN/m
2
)
Horizontal distance from the centre of trapdoor,
h
d
(mm)
Kikumoto et al. 2003
DEM
trapdoor
initial earth pressure
(=2.38kPa)
trapdoor


