1020
Proceedings of the 18
th
International Conference on Soil Mechanics and Geotechnical Engineering, Paris 2013
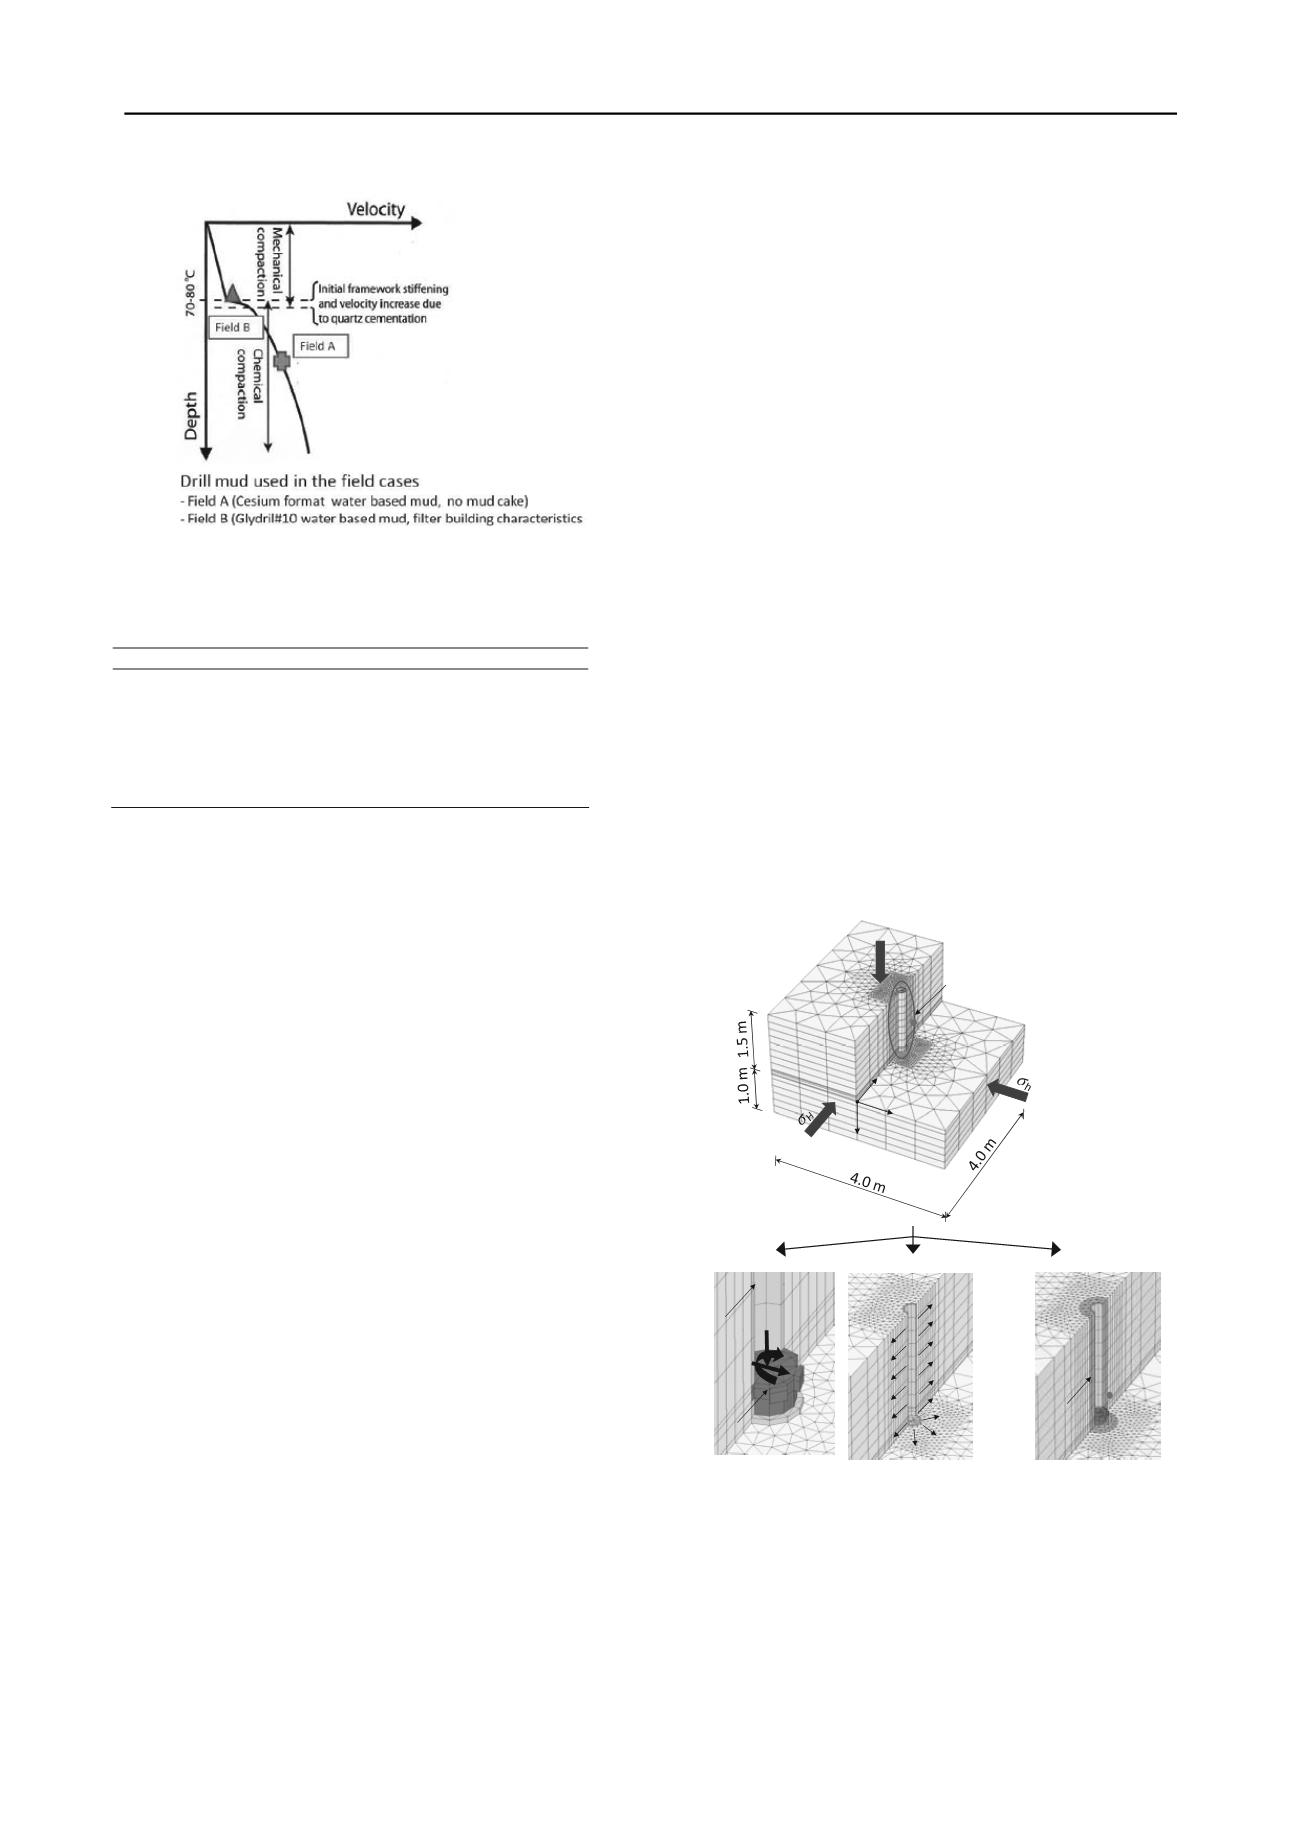
Figure 1. Field data used for study of formation damage. Depth of burial
varies between two fields A and B, leading to pronounce difference in
terms of quartz cementation. Also use of different muds leads to
different mud cakes at wellbore walls.
Table 1. Material properties at wellbore at Field A and B.
Parameters
Field A
Field B
Unit
Depth
~4100
~2400 mTVD
Porosity
16-25
27-32
%
Young modulus
5
GPa
Poisson’s ratio
0.15
0.27
-
Cohesion
8.7
3.2
MPa
Friction angle
33
29.1
degree
Tensile strength
3.2
1.2
MPa
formation during drilling and coring operations. In the first part,
an example of workflow will be outlined throughout the
numerical modelling performed at two macro (continuum) and
micro scales based on data from the two field cases: Field A and
B. Figure 1 illustrates the locations of Field A and B where the
Radial Diapole Profiling data is available. The material
properties at the two field cases are given in Table 1. They
basically differ from each other in term of burial depth, leading
to different degrees of cementation between grains.
The second part will present the FE-results calculated by
using the macro FE-model while the third part will discuss in
detail about the application of the 2D micro FE-model for
analysing and predicting tensile fracturing observed on a micro
level (grain scale) in the formation during drilling and coring
operations.
2 METHODOLOGY AND WORKFLOW
In the first stage a macro 3D FE-model was established for
calculation of continuum stress changes around wellbore, which
were mainly caused by lateral vibrations and torque from drill
bit, radial stress release and mud-fluid flowing into the
formation and temperature changes as illustrated in
Figure 2
.
Several assumptions have been made:
•
The rocks behave as a homogeneous material. Hence, its
mechanical behaviour can be described by using a
continuum mechanical approach;
•
The distances from the wellbore to the boundaries in the
two horizontal (x) and (z) and vertical (y) directions were
sufficiently large to avoid any effect of the outer boundaries
on the stress changes close to the wellbore;
•
The elements were modelled assuming an elastic
perfectly plastic, frictional-cohesive material that followed
the Mohr-Coulomb failure criterion after the onset of yield.
In addition to shear failure, the model also performs failure
in tension. The material parameters used in the Mohr-
Coulomb model are summarised in Table 1.
This FE-model was applied for the detailed study of the two
Field cases A and B presented in Figure 1. A transient pore
pressure analysis was performed in order to study the time
dependent dissipation of excess pore pressure due to the mud-
fluid flowing into the formation. In general, a total of five
numerical simulation steps need to be performed in order to
evaluate the stress changes in the rock surrounding the wellbore
during drilling and coring operations:
a. Initial stresses are first generated by applying the in-situ
stresses to the FE-model without the wellbore. The
considered stress states correspond to 2400 m “true vertical
depth” (TVD) and 4100 m TVD below mean sea level for
Field B and Field A, respectively;
b. The wellbore is then excavated under the hydraulic
support from the net mud pressure to simulate the drilling
stage;
c. In this step, forces at the drill bit are applied. All forces
from cutters, bit body and gauge pads are summed and
applied as resulting forces at the centre of the drill bit;
d. Then the mud-fluid infiltrates into the formation and
gives an applied increase of pore pressure around the
wellbore;
e. Finally, the reduction of the temperature is simulated by
reducing the volumetric strain.
From a parametric study the mud temperature was found to be
important with respect to generation of tensile fractures which
are the most plausible failure mechanism. Downhole
temperature logs measured at the drill bit were available, but
these did not cover the entire history of temperatures during the
various stages of drilling and circulations in the period between
drilling and logging of the actual intervals. Due to the large
impact of temperature on failure and the poorly documented
temperature history of the study intervals, an assumed constant
temperature change is applied one wellbore radius into the
formation in order to simulate the cooling of formation during
process of drilling. The stress situation one radius into the
formation was evaluated with respect to fracturing due to tensile
failure.
WOB
F
bit
From drill bit
Drill bit
Mud cake
TOB
From
temperature
T within 1
radius from
wellbore side
Frommud
v
Borehole
(r ×h : 0.108 × 1.5 m
infiltration of
mud-fluid
y
A
y
z
x
A
Figure 2. Full 3D FE modelling of different loads due to drill bit torque
and axial load, mud-flow into formation and temperature change within
one radius from wellbore wall.


