 
          1012
        
        
          Proceedings of the 18
        
        
          th
        
        
          International Conference on Soil Mechanics and Geotechnical Engineering, Paris 2013


            Proceedings of the 18


            th


            International Conference on Soil Mechanics and Geotechnical Engineering, Paris 2013


          Production of MH bearing sands and their shear tests were
        
        
          conducted using the temperature-controlled high-stress triaxial
        
        
          testing apparatus (Hyodo, et al.2008). For the simulation
        
        
          material, MH was formed in these host sands with 50%, 30%
        
        
          and 0% degree of MH saturation. From the results of density
        
        
          tests on natural cores from Nankai Trough, the porosities of the
        
        
          simulation materials were set as


            n


          =40% and 45%. In this paper,
        
        
          only the results of


            n


          =45% are presented. The method of
        
        
          formation of MH in the simulation materials is as follows.
        
        
          Firstly, an initial water content equivalent to the desired degree
        
        
          of MH saturation was prepared and then an unsaturated
        
        
          specimen, with diameter 30mm and height 60mm, was made
        
        
          using tamping to a given density. Next, the specimen was set in
        
        
          the cell of the apparatus and methane gas was injected into the
        
        
          specimen for 24hr at 10MPa pore water pressure, 13MPa cell
        
        
          pressure and at a temperature of 5
        
        
          ℃
        
        
          to form the MH. After
        
        
          stopping the methane gas injection and confirming the
        
        
          formation of MH, the specimen was filled with pure water in
        
        
          order to saturate it. A given effective stress was then applied
        
        
          and shear tests were performed under drained conditions with a
        
        
          rate of shear of 0.1%/min. After the shear test, the pore pressure
        
        
          was decreased to a level outside of the MH stability boundary in
        
        
          order to dissociate the MH which had been produced. The
        
        
          quantity of MH was measured and the degree of MH saturation
        
        
          was calculated by this amount of dissociated gas. The triaxial
        
        
          test results for host sands Ta, Tb, Tc and Td with an initial
        
        
          porosity of


            n


          =45%, under an effective confining stress of
        
        
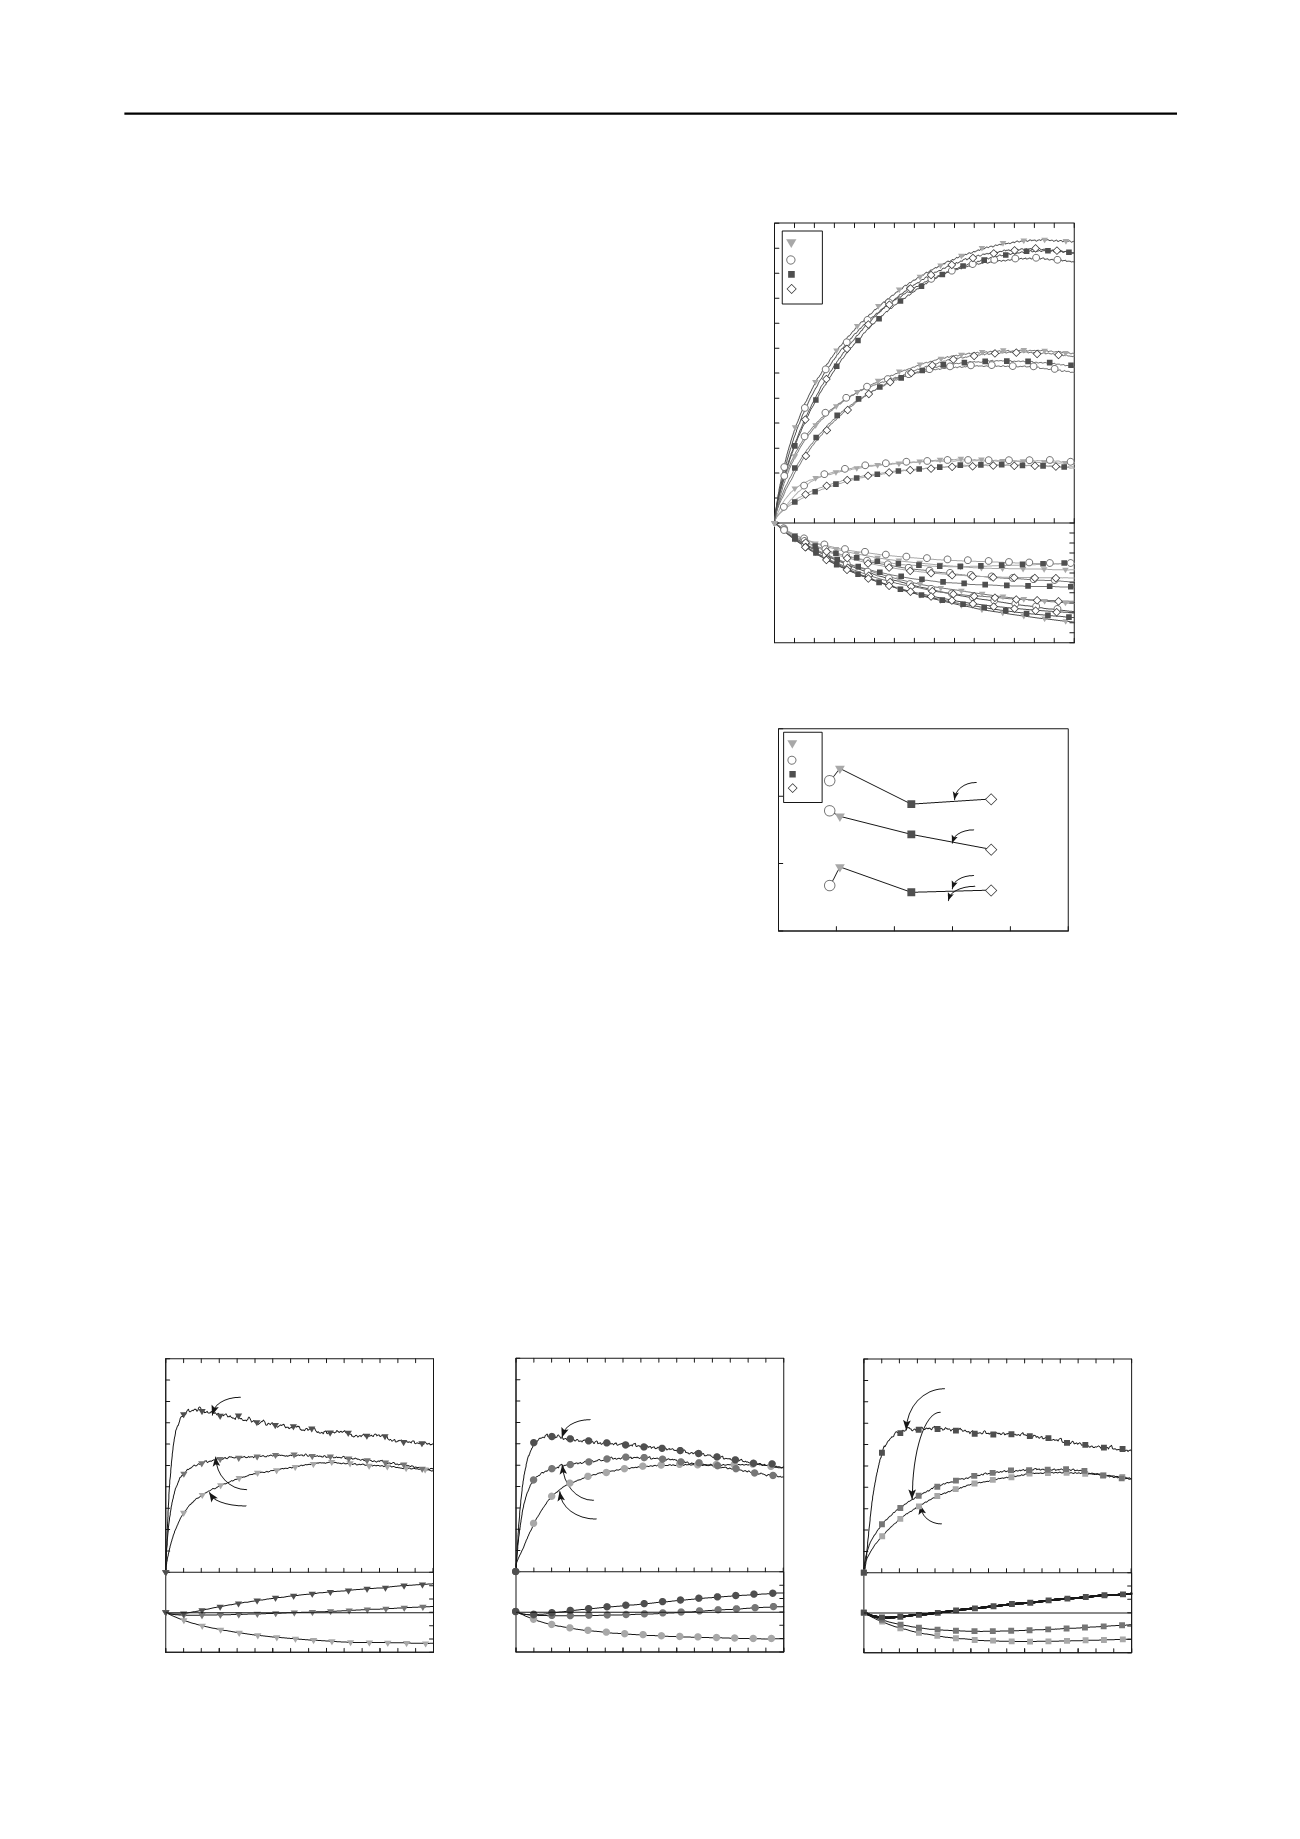
          1MPa, 3MPa and 5MPa are presented in Figure 2. In the figure,
        
        
          the initial stiffness and residual strength slightly decreases with
        
        
          increasing fines content, however there is no marked difference.
        
        
          Volumetric strain induced by shear appears on the contractive
        
        
          side and increases with increasing fines content and confining
        
        
          stress. Figure 3 shows the variation of the secant modulus at 1%
        
        
          axial strain against fines content for each material with each
        
        
          confining stress. It can be seen that there is a trend for the secant
        
        
          modulus to decrease with increasing fines content at all
        
        
          confining stresses. However, this is not true for Ta and Tb, due
        
        
          to the effect of their mean particle size. Fig.4(a)-(c) show the
        
        
          shear testing results for MH bearing sands by using Ta, Tb and
        
        
          Tc as host sands. Tests were performed at a porosity of


            n


          =45%
        
        
          with effective confining stress of 1MPa at various degrees of
        
        
          MH saturation. From the figures it can be observed that initial
        
        
          stiffness and peak residual strengths increased as the degree of
        
        
          MH saturation increased. Corresponding volumetric strain
        
        
          increases and behaves in a more dilative manner with increasing
        
        
          degrees of MH saturation. In Figure 5, the difference between
        
        
          the peak strength of MH bearing sand and the strengths of the
        
        
          host sands, at an axial strain corresponding to the peak value of
        
        
          MH bearing sand, are normalized by effective confining stress
        
        
          and then plotted against the degree of MH saturation. It can be
        
        
          observed that the strength increased rapidly when the degree of
        
        
          MH saturation passed 30%, and the rate of increase decreases in
        
        
          order of Ta, Tb and Tc. It is therefore obvious that the grain size
        
        
          distribution affects the cementation effect of MH.
        
        
          4   SHEAR CHARACTERISTICS OF MH BEARING SANDS
        
        
          BY HIGH-STRESS PLANE STRAIN SHEAR TESTING
        
        
          An overview of the testing equipment (Yoneda et al. 2011) is
        
        
          shown in Figure 6. This apparatus can control temperatures and
        
        
          pressures equivalent to an MH reservoir in deep seabeds.
        
        
          Additionally, observation windows are installed in front of and
        
        
          behind the specimen in order to allow the local deformation of
        
        
          the specimen during shear tests to be measured. The specimen is
        
        
          a cuboid with 80mm width, 60mm thickness and 160mm height.
        
        
          A 5mm
        
        
          x
        
        
          5mm mesh was drawn on the membrane in front of
        
        
          the observation window. The observation was performed using
        
        
          a digital camera(g), which took pictures according to a timer
        
        
          controlled by a remote system. An LED(h) was installed to
        
        
          brighten the pressure cell(i), which allowed the specimen(e) to
        
        
          Figure 2 Variation of deviator stress and volumetric


            s


          train
        
        
          against axial strain for host sands
        
        
          0
        
        
          10 20 30 40 50
        
        
          0
        
        
          1
        
        
          2
        
        
          3
        
        
          T
        
        
          a
        
        
          T
        
        
          b
        
        
          T
        
        
          c
        
        
          T
        
        
          d
        
        
          Secant modulus


            E


          (


          (MPa)
        
        
          Fines content


            F


          c
        
        
          (%)


            n


          =45%


          c
        
        
          '=1MPa


          c
        
        
          '=3MPa


          c
        
        
          '=5MPa
        
        
          Figure 4 Variation of deviator stress and volumetric


            s


          train against axial strain for methane hydrate bearing sands
        
        
          (b) T
        
        
          b
        
        
          (a)T
        
        
          a
        
        
          (c) T
        
        
          c
        
        
          0
        
        
          1
        
        
          2
        
        
          3
        
        
          4
        
        
          5
        
        
          6
        
        
          0
        
        
          -6
        
        
          0
        
        
          10
        
        
          20
        
        
          30
        
        
          Volumetric strain


          v
        
        
          (%)
        
        
          Axial strain


          a
        
        
          (%)
        
        
          Deviator stress


            q


          (MPa)
        
        
          T
        
        
          b


          c
        
        
          '=1MPa


            S


          MH
        
        
          =0%


            n


          =45.5%


            S


          MH
        
        
          =31.1%


            n


          =45.5%


            S


          MH
        
        
          =47.4%


            n


          =45.3%
        
        
          0
        
        
          1
        
        
          2
        
        
          3
        
        
          4
        
        
          5
        
        
          6
        
        
          0
        
        
          -6
        
        
          0
        
        
          10
        
        
          20
        
        
          30
        
        
          Volumetric strain


          v
        
        
          (%)
        
        
          Axial strain


          a
        
        
          (%)
        
        
          Deviator stress


            q


          (MPa)
        
        
          T
        
        
          c


          c
        
        
          '=1MPa


            S


          MH
        
        
          =0%


            n


          =45.0%


            S


          MH
        
        
          =24.3%


            n


          =45.2%


            S


          MH
        
        
          =58.6%


            n


          =44.9%
        
        
          0
        
        
          1
        
        
          2
        
        
          3
        
        
          4
        
        
          5
        
        
          6
        
        
          0
        
        
          -6
        
        
          0
        
        
          10
        
        
          20
        
        
          30
        
        
          Volumetric strain


          v
        
        
          (%)
        
        
          Axial strain


          a
        
        
          (%)
        
        
          Deviator stress


            q


          (MPa)
        
        
          T
        
        
          a


          c
        
        
          '=1MPa


            S


          MH
        
        
          =0%


            n


          =45.1%


            S


          MH
        
        
          =24.6%


            n


          =45.5%


            S


          MH
        
        
          =43.7%


            n


          =44.8%
        
        
          Figure 3 Relationship between secant modulus
        
        
          and fines content
        
        
          0
        
        
          4
        
        
          8
        
        
          12
        
        
          12
        
        
          6
        
        
          0
        
        
          0
        
        
          10
        
        
          20
        
        
          30
        
        
          Volumetric strain


          v
        
        
          (%)
        
        
          Axial strain


          a
        
        
          (%)
        
        
          Deviator stress


            q


          (MPa)


            S


            MH


          =0%


            n


          =45%


          a
        
        
          =30%
        
        
          T
        
        
          a
        
        
          T
        
        
          b
        
        
          T
        
        
          c
        
        
          T
        
        
          d