1014
Proceedings of the 18
th
International Conference on Soil Mechanics and Geotechnical Engineering, Paris 2013
Proceedings of the 18
th
International Conference on Soil Mechanics and Geotechnical Engineering, Paris 2013
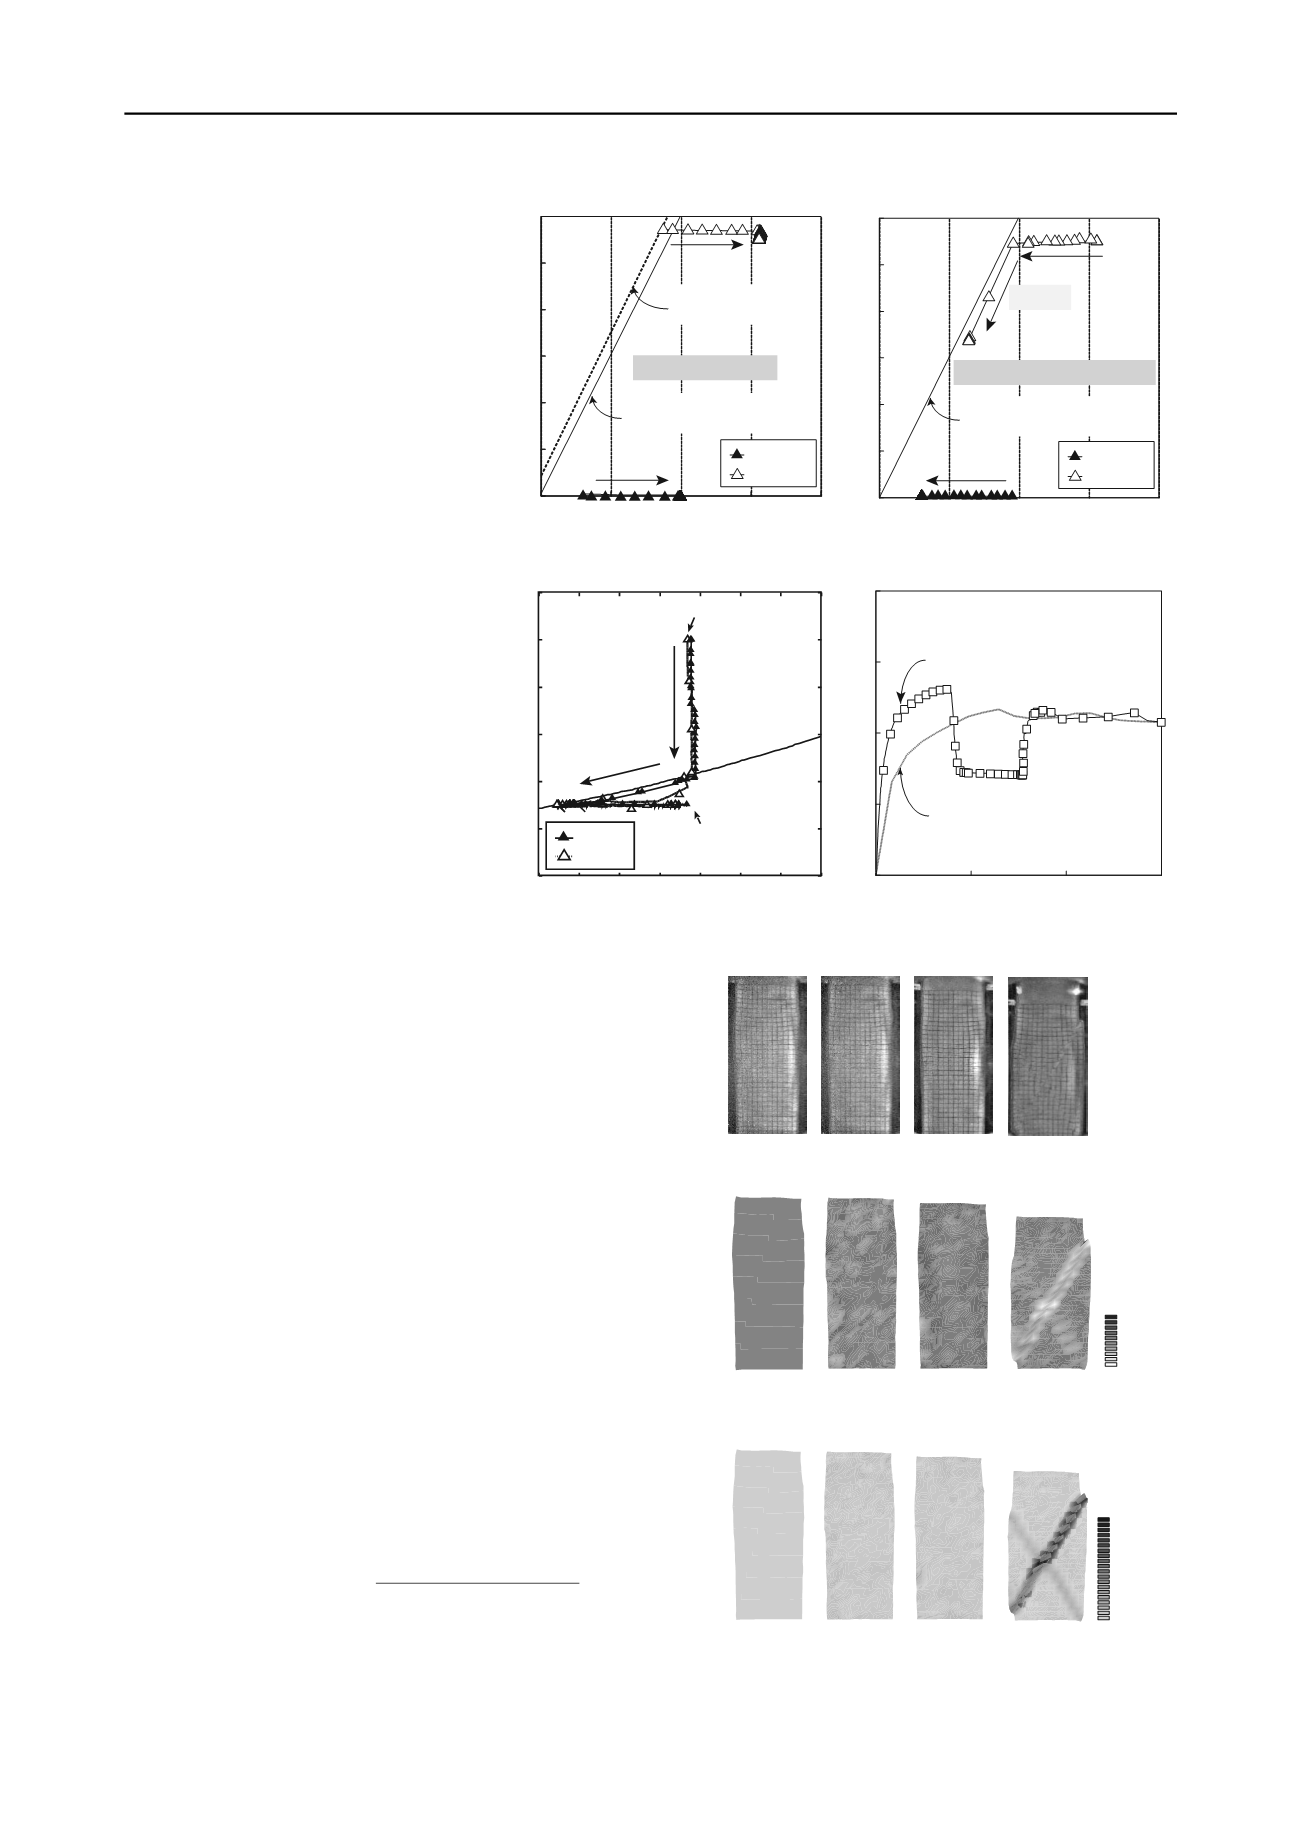
Point (c) corresponds to the point where
MH is dissociated. Point (d) corresponds to
the point where the specimen failed due to
an increase in pore water pressure
(repressurization). Photo 1 shows the
specimen at each axial strain during Figure
12. In Case 2, the specimen failed during
repressurization when the stress path
reached the strength of the host sand. From
the photo, it can be seen that from point (d)
a shear band appeared in the specimen and
failure occurred. Figures 13 and 14 show
the volumetric strain and maximum shear
stress contour obtained during Photo 1.
From point (a) to (c) the specimen was
consolidated and the volume was
compressed. At (d), volumetric dilation
occurred in the shear band and local
deformation was observed clearly.
5 CONCLUSIONS
(1) In drained shear tests on host sands,
initial stiffness and strength decreased with
increasing fines content and there was a
strong trend for contraction of volumetric
strain.
(2) For all specimens, the initial stiffness
and peak strength of those containing MH
increased due to MH`s cementation force,
and volumetric strain behaved in a more
dilative manner. However, both initial
stiffness and strength decreased with
increasing fines content of host sands.
(3) In plane strain shear tests, Tc and
Toyoura sand as host sands with and
without MH were compared. Due to the existence of MH, initial
stiffness and strength increased in both materials, however the
tendency was more apparent in Toyoura sand compared with
Tc.
(4) The local deformations occurred more clearly in Toyoura
sand, compared with fine material. It also appeared more clearly
when the specimen contained MH.
(5)
During depressurization, marked deformation was not
observed, because of an increase of effective stress. However,
after depressurization, repressurization caused the specimen to
fail in the case of high initial shear stress conditions.
6 ACKNOWLEDGEMENTS
The first half of the present work was done as the activity of
Research Consortium for Methane Hydrate Resources in
Japan (MH21 Research Consortium) by the Ministry of
Economy and Industry and the latter half was supported by
KAKENHI 20246080 by the Ministry of Education and Science
in Japan. The authors would like to express their sincere thanks
to their supports.
7 REFERENCES
Hyodo, M., Nakata, Y., Yoshimoto, N. and Yoneda, J. 2008. Shear
strength of methane hydrate bearing sand and its deformation
during dissociation of methane hydrate.
Proc. of 4th Int. Symp. on
Deformation Characteristics of Geomaterials
, 549-556.
MH21 Research Consortium 2012.
/
Yamamoto, K. 2009. Production Techniques for Methane Hydrate
resources and Field Test Programs.
Journal of Geography,
Vol.118,
No. 5, 913-934.
Yoneda, J., Nakata, Y. 2011. Deformation of deep seabed during
dissociation of methane hydrate. Proc.
The 14th Asian Regional
Conference on Soil Mechanics and Geotechnical Engineering.
ISSMGE.
Paper
㻌
ID290.
Figure 12 Relationship between stress ratio
and axial strain (Case2)
0.0
0.5
1.0
0
5
10
15
Stress ratio (
'
1
-
'
3
)/(
'
1
+
'
3
)
Axial strain
a
(%)
Case2
(a)
(c)
(d)
(b)
S
MH
=0.0%
1 2 3 4 5 6 7 8
0
2
4
6
8
10
12
Temperature
T
(
o
C)
Stability boundary
After depressurization
(Water-Methane)
(Methane hydrate)
Initial condition
Case1
Case2
Pore pressure
u
(MPa)
Figure 11 Temperature and pore pressure
path in depressurization test
(a)
a
=3.5%
(b)
a
=4.0% (c)
a
=7.2% (d)
a
=12.7%
Figure 13 Contour of volumetric strain at each axial strain
(Case2)
Figure 14 Contour of maximum shear strain
at each axial strain (Case2)
0
25
50
75
100
(%)
max
Photo 1 The specimen image at each axial strain(Case2)
-25
0
25
(%)
v
(a)
a
=3.5%
(b)
a
=4.0% (c)
a
=7.2% (d)
a
=12.7%
(a)
a
=3.5%
(b)
a
=4.0% (c)
a
=7.2% (d)
a
=12.7%
Figure 10 Stress path in repressurization
test
Figure 9 Stress path in depressurization test
0
1
2
3
4
5
6
0
5
10
15
20
Principal stress difference (
'
1
-
'
3
)/2 (MPa)
Mean principal stress (
'
1
+
'
3
)/2 (MPa)
Case1
Case2
Failure envelope of
MH bearing sand
Failure envelope of
Host sand
Depressurization
0
1
2
3
4
5
6
0
5
10
15
20
Principal stress difference (
'
1
-
'
3
)/2 (MPa)
Mean principal stress (
'
1
+
'
3
)/2 (MPa)
Water pressure recovery
Failure envelope of
Host sand
Failure
Case1
Case2


