534
Proceedings of the 18
th
International Conference on Soil Mechanics and Geotechnical Engineering, Paris 2013
other hand, the zone of influence for actual dewatering volume
of the structures would be a few hundreds of meters and
therefore, the dewatering volume would be affected by the
characteristics of surrounding soil within this larger zone. In
order to assess the reliability of the pumping test results for
dewatering calculation, the uniformity of the soil within the
dewatering zone was verified using the correlation described in
the previous sections.
For each structure location, a zone of influence of 350 m
radius is assumed. Corrected K
KC
in conjunction with K values
directly obtained from field tests (slug and pumping tests)
within the assumed zones around each structure were pulled out
of the overall data available. Subsequently, the statistical
distributions of K-values for every soil class encountered within
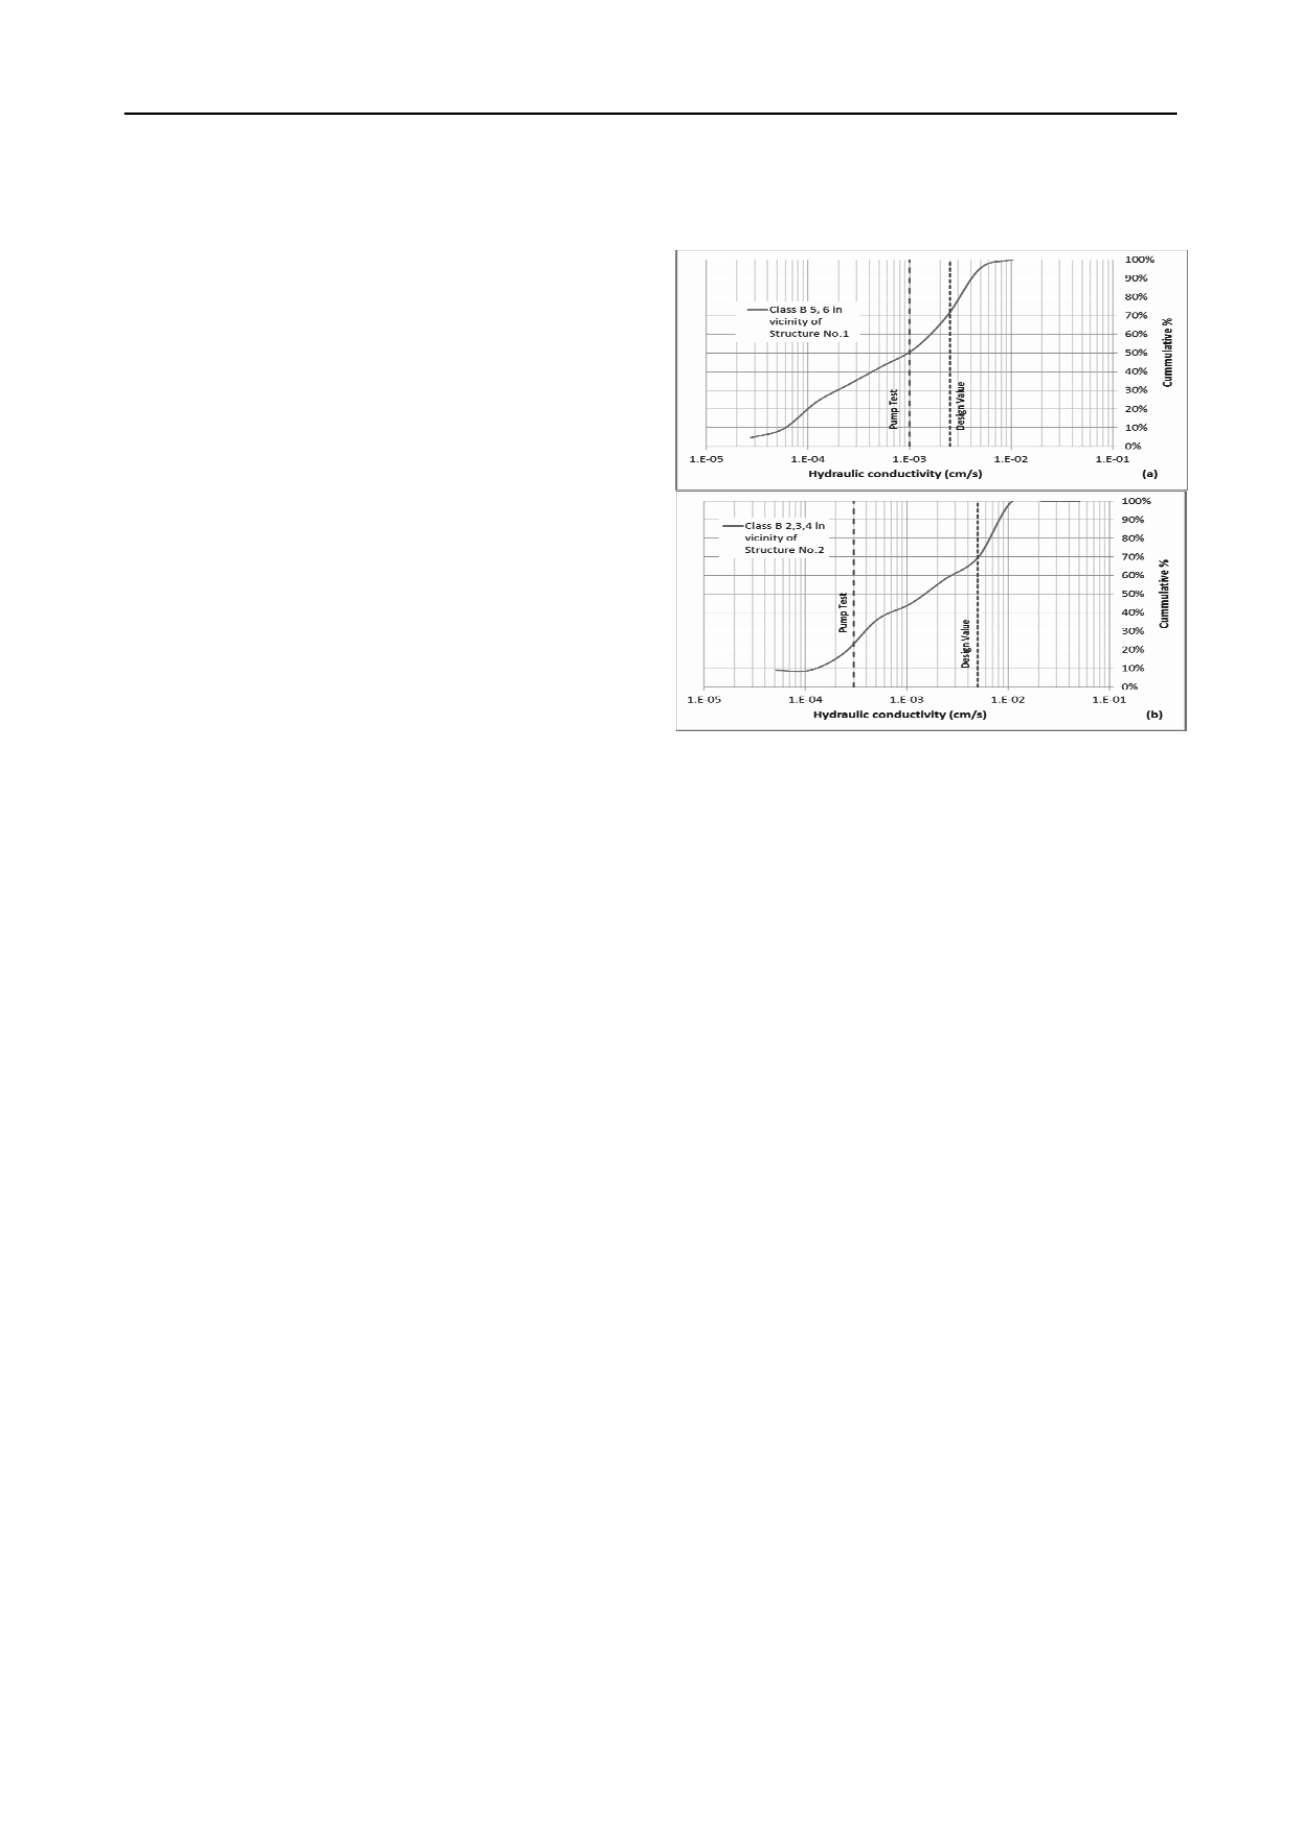
the dewatering zone were prepared for each structure. Examples
of the cumulative distributions are shown in Figure 3a and 3b
for Structure No.1 and No.2.
Based on the localized distribution of the K-values for each
structure, the pumping tests results for some structures fall
within 70 percentile or higher; on the other hand, the results for
other structures could be as low as 20 to 50 percentile.
A detailed review of the results and interpretive subsurface
profile showed that generally when the zone of the influence of
the pumping tests was small, the K obtained from pumping test
tends to be on the lower side of the cumulative distribution.
This has also been augmented where random presence of
pockets/seams of Class C soil within Class B deposits has
dominant effect on pumping test results. The design K-value for
dewatering calculation has been selected based on the result of
the localized distribution of the K-values prepared for each
structure. Two examples are shown in Figure 3.
4 CONCLUSION
Glacial deposits comprise of variable soil types in relatively
short distances. Conventional pumping tests may not provide
fully reliable results for a proper dewatering calculation as the
zone of influence of a pump test may only extend tens of meters
while the actual dewatering volume of a structure is affected by
the characteristics of surrounding soil within hundreds of
meters. Presence of pockets/seams with higher silt content
within sandy deposits has dominant effect on pumping test
results. Smaller the zone of influence of the pumping tests, K
obtained from the test tends to be on the lower side of the
cumulative distribution for the dewatering zone of influence.
The pumping test results for some structures could be as low as
20 to 50 percentile of accumulative distribution. It is imperative
to assess the reliability of the pumping test results for
dewatering calculation in the variable glacial deposits;
particularly when the zone of the influence of the pumping tests
is relatively small.
The Kozeny-Carman formula takes into account specific
surface area of full range of particle sizes and soil void ratio and
proven to provide reliable predictions of K for wide range of
soils. Based on the results of this large scale investigation,
Kozeny-Carmen formula with incorporation of the site specific
correlation factor, predicts K values ranging between 1/3 to 3
times the in-situ hydraulic conductivity (K
field
) for the glacial
deposits. This provides a powerful tool in verifying the
reliability of pumping test results in glacial deposits. However,
careful consideration must be given to proper interpretation of
the field test results and applicability of the formula to site
conditions.
It also should be noted that K of weathered zone of clayey
deposits is controlled by flow through the fractures. The field K
measured in this zone could be up to a few orders of magnitude
greater than the clay matrix. Field measurements in this zone
may also be sensitive to smearing during the installation of
piezometers. Physical scale of field measurements may strongly
influence the resulting hydraulic conductivity values.
Figure 3 Localized distribution of hydraulic conductivity for (a) Class
B5,6 in Structure No.1 and Class B2,3,4 Structure No.2.
5 ACKNOWLEDGEMENTS
The authors would like express their gratitude to Metrolinx for
authorizing the preparation of this paper.
6 REFERENCES
Carman, P. C. 1938. The determination of the specific surface of
powders.
J. Soc. Chem. Ind. Trans.
57, 225.
Carman, P. C. 1956. Flow of gases through porous media,
Butterworths
Scientific Publications.
London.
Carrier, W. D. 2003. Goodbye, Hazen; Hello, Kozeny-Carman.
Journal
of Geotechnical and Geoenvironmental Engineering
, 129(11),
1054-1056
Chapuis, R.P. and Aubertin, M. 2003. On the use of the Kozeny–
Carman equation to predict the hydraulic conductivity of a soil.
Canadian Geotechnical Journal,
40(3), 616-628.
Chapuis R.P. 2002. The 2000 R.M. Hardy Lecture: Full-scale hydraulic
performance of soil–bentonite and compacted clay liners.
Canadian
Geotechnical Journal,
39(2), 417-439.
D’Astous et al. 1989. Fracture effects in the shallow groundwater zone
in weather Sarnia-area clay.
Canadian Geotechnical Journal,
26,
43-56.
Hendry, M. J. 1982. Hydraulic conductivity of a glacial till in Alberta.
Ground Water
20(2), 162-169.
Kozeny, J. 1927. Ueber kapillare Leitung des Wassers im Boden.
Wien,
Akad. Wiss.
136 (2a), 271.
Lambe, T. W., and Whitman, R. V. (1969). Soil mechanics.
Wiley, New
York.
Locat, J., Lefebvre, G., Ballivy, G. 1984. Mineralogy, chemistry, and
physical properties interrelationships of some sensitive clays from
Eastern Canada.
Canadian Geotechnical Journal
, 21 (3), 530-540.
McKay L., Cherry J., and Gillham R 1993. Field Experiments in a
Fractured Clay Till.
Water Resources Research
, 29(4), 1149-1162.
Ruland W. et al. 1991. The depth of active groundwater flow in a clayey
till plain in southwestern Ontario.
Ground Water
29(3), 405-417
Sharpe 1980. Quaternary Geology Series, Quaternary Geology –
Toronto and Surrounding Area, Southern Ontario.
Ontario
Geological Survey Map 2204.


