533
Technical Committee 102 /
Comité technique 102
1.E‐07
1.E‐06
1.E‐05
1.E‐04
1.E‐03
1.E‐02
1.E‐01
1.E+00
1.E‐07 1.E‐06 1.E‐05 1.E‐04 1.E‐03 1.E‐02 1.E‐01 1.E+00
K (Field) (cm/sec)
K (Kozeny‐Carman) (cm/sec)
Correlation line
K(field) = 3 K(KC)
K(field) = 1/3 K(KC)
Figure 1 In-situ measured field hydraulic conductivity versus calculated
by Kozeny-Carmen Formula (K
KC
vs. K
field
)
The dashed line represents the equality line and the solid
black line represents the site specific correlation line which has
a slope shown in equation (2).
log K
field
= 1.03×log K
KC
(2)
The grey lines in Figure 1 represent the boundaries that
encompass 90% of the data points. These lines have the same
slope as the correlation line with ±0.5 offset in the log-log scale.
This indicates that Kozeny-Carmen formula with incorporation
of the site specific correlation factor of 1.03 (equation (2))
predicts a K value ranging between 1/3 to 3 times the in-situ
measured field hydraulic conductivity (K
field
) for the glacial
deposits in this specific site. These conclusions are comparable
to the margin obtained from laboratory permeability test results
shown by Chapuis (2002) and Chapuis and Aubertin (2003).
3.3
Overall hydraulic conductivity for each soil class
Hydraulic conductivity (K) values for each soil class of glacial
deposits were calculated using the K-C formula as per method
described in the previous sections for about 1,200 grain size
analyses conducted on various soil types along the alignment.
Equation (2) is then used to correct K
KC
assuming that 90% of
the predicted values fall between 1/3 to 3 times the actual K in
the field. The statistical parameters were calculated for the
corrected K
KC
obtained for each soil class in conjunction with
the K values directly obtained from field tests (slug and
pumping tests). The statistical distribution of K for each soil
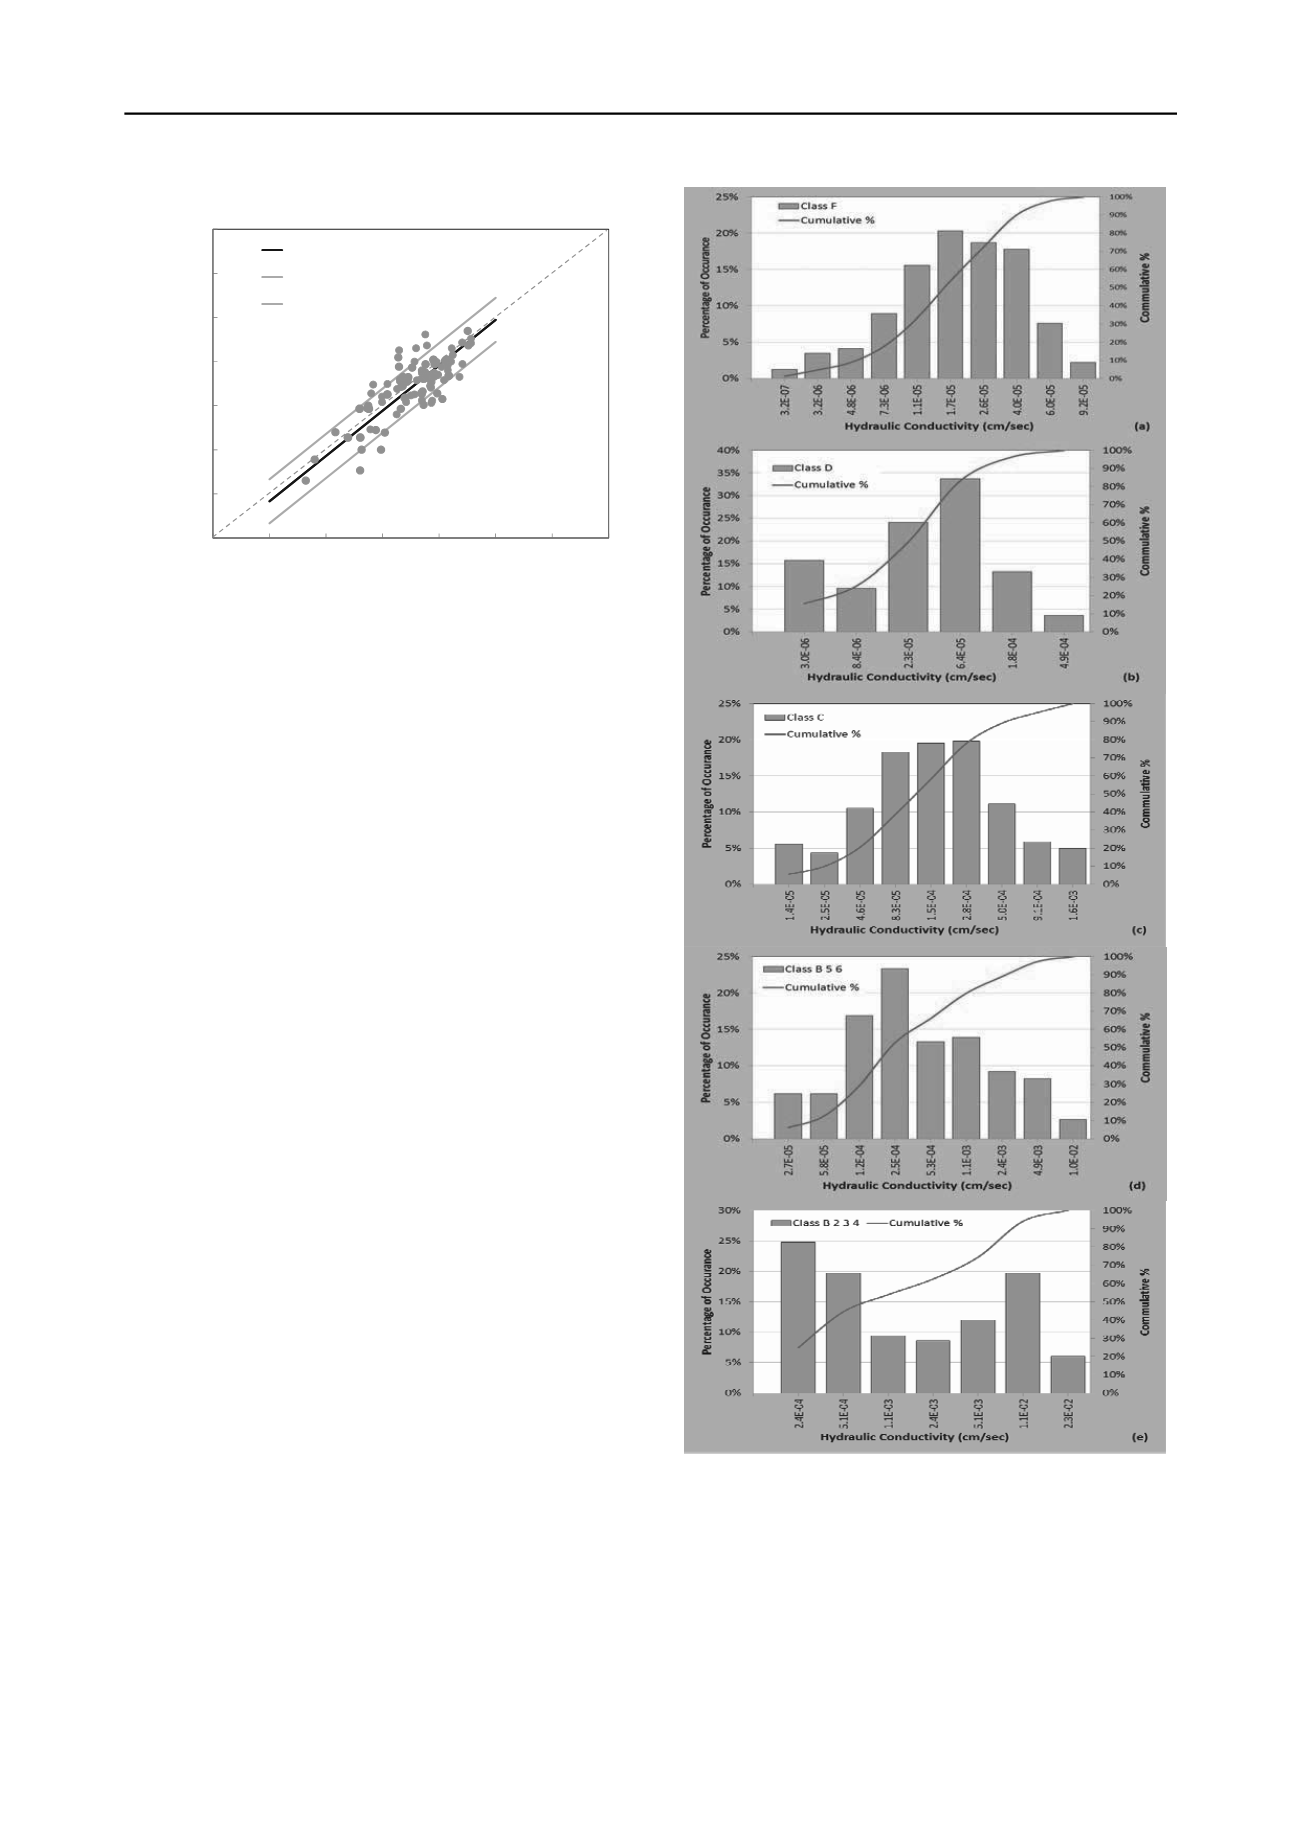
class is plotted in histograms as shown in Figure 2a to 2e.
The K values obtained from the field tests conducted in the
plastic till deposits (Class F) with obvious signs of weathering
and fracture has also been added to the calculated K values and
other field measurement results which all together included in
the statistical distribution of K for Class F (Figure 2a).
Generally, the higher end of the K distribution in Figure 2a is
associated with the field measured hydraulic conductivity in the
fractured plastic till. This is in conformance with the finding of
other studies in similar soil condition (e.g., D’Astous 1989,
Ruland 1991). Although, some of the slug tests conducted on
this fractured zone were as low as the results typically
associated with soil matrix values; which could by the results of
the smeared zone tend to form around augered boreholes.
Figure 2a to 2e Statistical distribution of hydraulic conductivity for
various soil classes of glacial deposits obtained from the investigation
.
The K values for Class B2,3,4 (interstadial sand with less
than 20% fines) fit a bimodal distribution (Figure 2e). Further
review of the resutls indicated that the higher peak (10
-2
cm/s) is
associated to sand with leass than about 10% fine; while the rest
of the class resutled to the lower peak.
3.4
Design hydraulic conductivity for structures
The zone of influence for 72 hours pumping tests ranged from
15 m to less than 100 m, depending on the location. On the


