538
Proceedings of the 18
th
International Conference on Soil Mechanics and Geotechnical Engineering, Paris 2013
4.4
The S-SPT test procedure
Normalized (N
1
)
60
1
10
100
Ratio (Go/pa)/N
60
10
100
1000
Unaged
uncemented sands
Upper bound
(cemented geomaterials)
Lower bound
(cemented geomaterials)
Lateritic Soils
Saprolitic Soils
An S-SPT test was carried out using this system in the studied
site. Seismic data were recorded from waves generated every
one meter depth up to 21 m, right after the N SPT measurement
using the equipment described in the previous sub-item. A six
box arrangement was placed on the ground surface after
removing the top soil to enable better coupling. The distance
between each box (which contains a pair of geophone) was 1.5
m and they were all placed between 4.5 m to 12.0 m away from
the test borehole.
4.5
The S-SPT testing data
The N
60
values measured during the S-SPT test carried out at
the studied site are presented in Figures 9.b. This hybrid test
allowed determined Vs simultaneously to N every 1 m interval
(Figure 8.c) for calculating Go (Figure 8.d). The Go/N
60
values
versus
depth are also presented in Figure 8.e for the studied site
with no averaging.
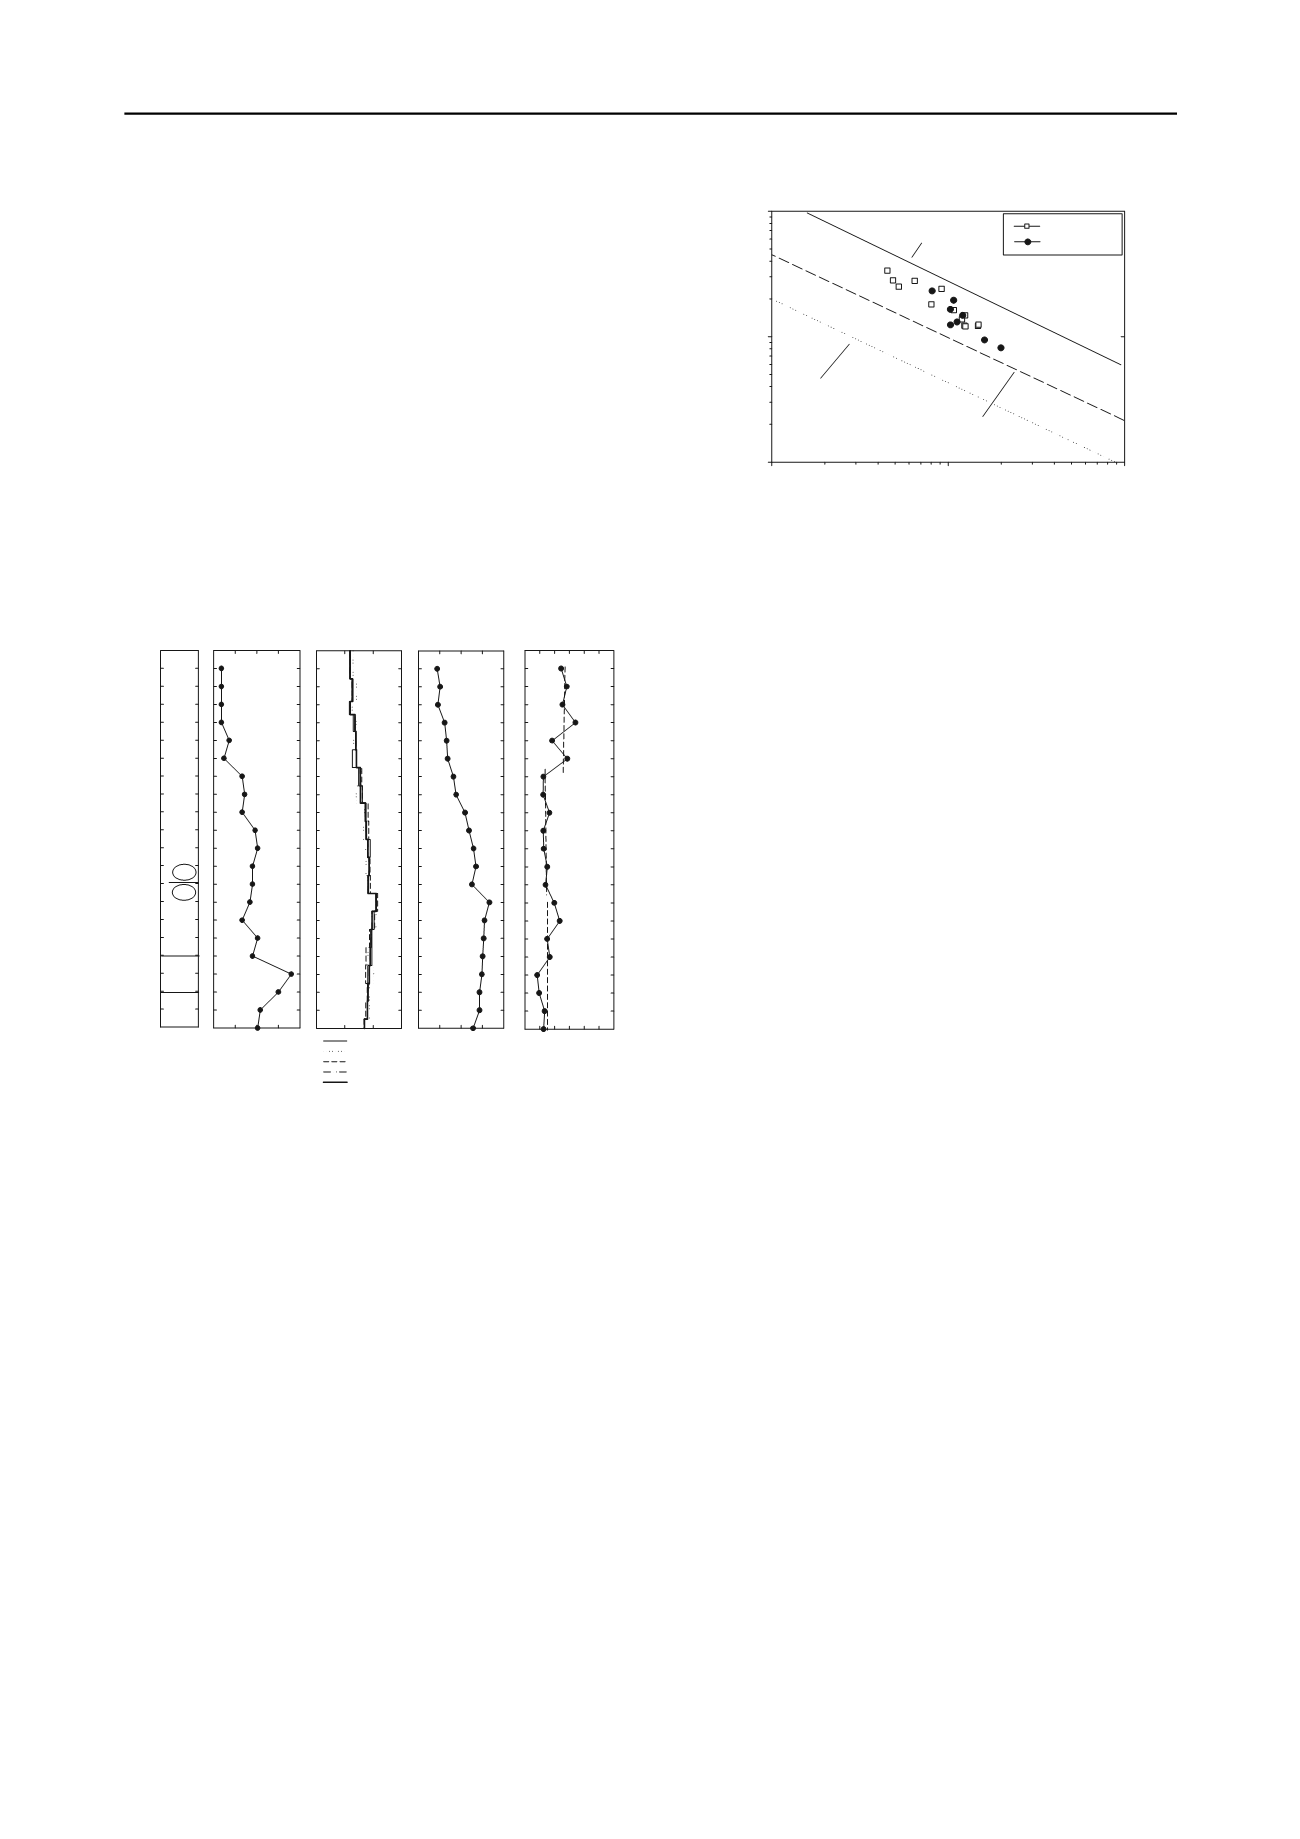
Figure 9. Relationship between Go and N
60
for the seismic SPT test.
0 10 20 30 40
Depth (m)
0
1
2
3
4
5
6
7
8
9
10
11
12
13
14
15
16
17
18
19
20
21
0 200 400 600
Vs (m/s)
Go (MPa)
Go / N 60
(b)
(c)
(d)
N 60
(a)
0 100 200 300 400
(c)
0 10 20 30 40 50 60
LA'
NA'
1
2
3
1-Red clayey fine sand
2-Red clayey silty fine sand
3-Red clayey fine sand
SM -SC
Vs - 6,0m
Vs - 8,0m
Vs - 10,0m
Vs - 12,0m
Vs avr
SPT profile
(d)
(e)
5 CONCLUSIONS
It was observed that the average ratio Go/N from several SPT
and seismic tests carried out in the studied site was higher in the
lateritic soil than in the saprolitic soil, particularly in the top
layer. The seismic SPT test was used to derive Go/N values in
the same site. Similar results were achieved with this single test,
which allows determining both parameters simultaneous,
reducing the effects of site variability. Relating an elastic
stiffness (Go) to an ultimate strength (N value) is an interesting
approach to help identify tropicals soils since the low strain
modulus from seismic tests reflects the weakly cemented
structure of lateritic soils while the SPT sampler penetration
brakes down all cementation. The preliminary results from the
seismic SPT test indicate that this hybrid test opens up new
possibilities for geotechnical site characterization of tropical
soils, based on the relationship Go/N, which is similar to the
Go/qc ratio in the SCPT test.
6 ACKNOWLEDGEMENTS
The authors gratefully acknowledge FAPESP (
State of São
Paulo Research Foundation
) and CNPq (
National Council for
Scientific and Technological Development
).
Figure 8. S-SPT testing data and Go/N
60
for the studied site.
4.6
The Go/N ratio
The Go/N
60
profile (Figure 8.e) obtained from the S-SPT test
data are similar to what was found when averaging all SPT and
seismic test data (Figure 4.e) for the top lateritic layer (1 to 6 m
depth) with a lower average Go/N
60
equal to 27, a bit lower than
what was previously found, 35. In the lower part of the lateritic
layer (6 to 13 m depth) it was found an average Go/N
60
equal to
14, also lower than what was previously found (23) and the
same average value for the saprolitic layer.
7 REFERENCES
Bang, E. S. & Kim, D.S. 2007. Evaluation of shear wave velocity
profile using SPT based up-hole method, Soil Dynamics and
Earthquake Engineering 27, p. 741-758.
Giacheti, H. L. & De Mio, G. 2008. Seismic cone penetration tests on
tropical soils and the ratio Go/qc. 3
rd
Geotechnical and Geophysical
Site Characterization Conference, ISC´3, Taiwain, v.1. p. 1289-
1295.
These data were also plotted in the Go/N
60
versus
(N
1
)
60
chart as shown in Figure 9. All the data points are in the upper
bound for cemented sands. In this case the difference between
lateritic and saprolitic soils is not so clear, just the upper portion
of the lateritic layer reflects a higher degree of cementation. Soil
variability in this particular site probably related to the
morphogenetic and pedogenetic processes, already pointed out
by Giacheti et al (2003) and Giacheti & De Mio (2008) could
explain the observed differences.
Giacheti, H. L.; Peixoto, A. S. P. & Marques, M. E. M. 2003. Cone
Penetration Testing on Brazilian Tropical Soils. XII Panamerican
Conference on Soil Mechanics and Geotechnical Engineering,
Cambridge/USA, v.1. p. 397-402.
Nogami, J. S. & Villibor, D. F. 1981. Uma nova classificação de solos
para finalidades rodoviárias, Simpósio Brasileiro de Solos Tropicais
em Engenharia, Brasil, V. 1, p. 30-41.
Pedrini, R. A. A. 2012. Desenvolvimento de sistema para realização de
sísmica up-hole em conjunto com sondagem SPT. M.Sc. thesis,
FEB/Unesp. Bauru/SP, Brazil.
Pedrini, R. A. A. & Giacheti, H. L. 2012. The seismic SPT to determine
the maximum shear modulus, 4
th
Geotechnical and Geophysical
Site Characterization Conference, ISC´4, Brazil, CD-Rom.
Schnaid, F.; Lehane, B. & Fahey, M. 2004. In situ test characterization
of unusual geomaterials. 2
nd
Geotechnical and Geophysical Site
Characterization Conference, ISC´2, Portugal, v. 1. p. 49-74.
Viana da Fonseca. A. & Coutinho, R. Q. 2008. Characterization of
residual soils, 3
rd
Geotech. and Geoph. Site Characterization Conf.,
ISC´3, Taiwain, v. 1. p. 195-249.


