536
Proceedings of the 18
th
International Conference on Soil Mechanics and Geotechnical Engineering, Paris 2013
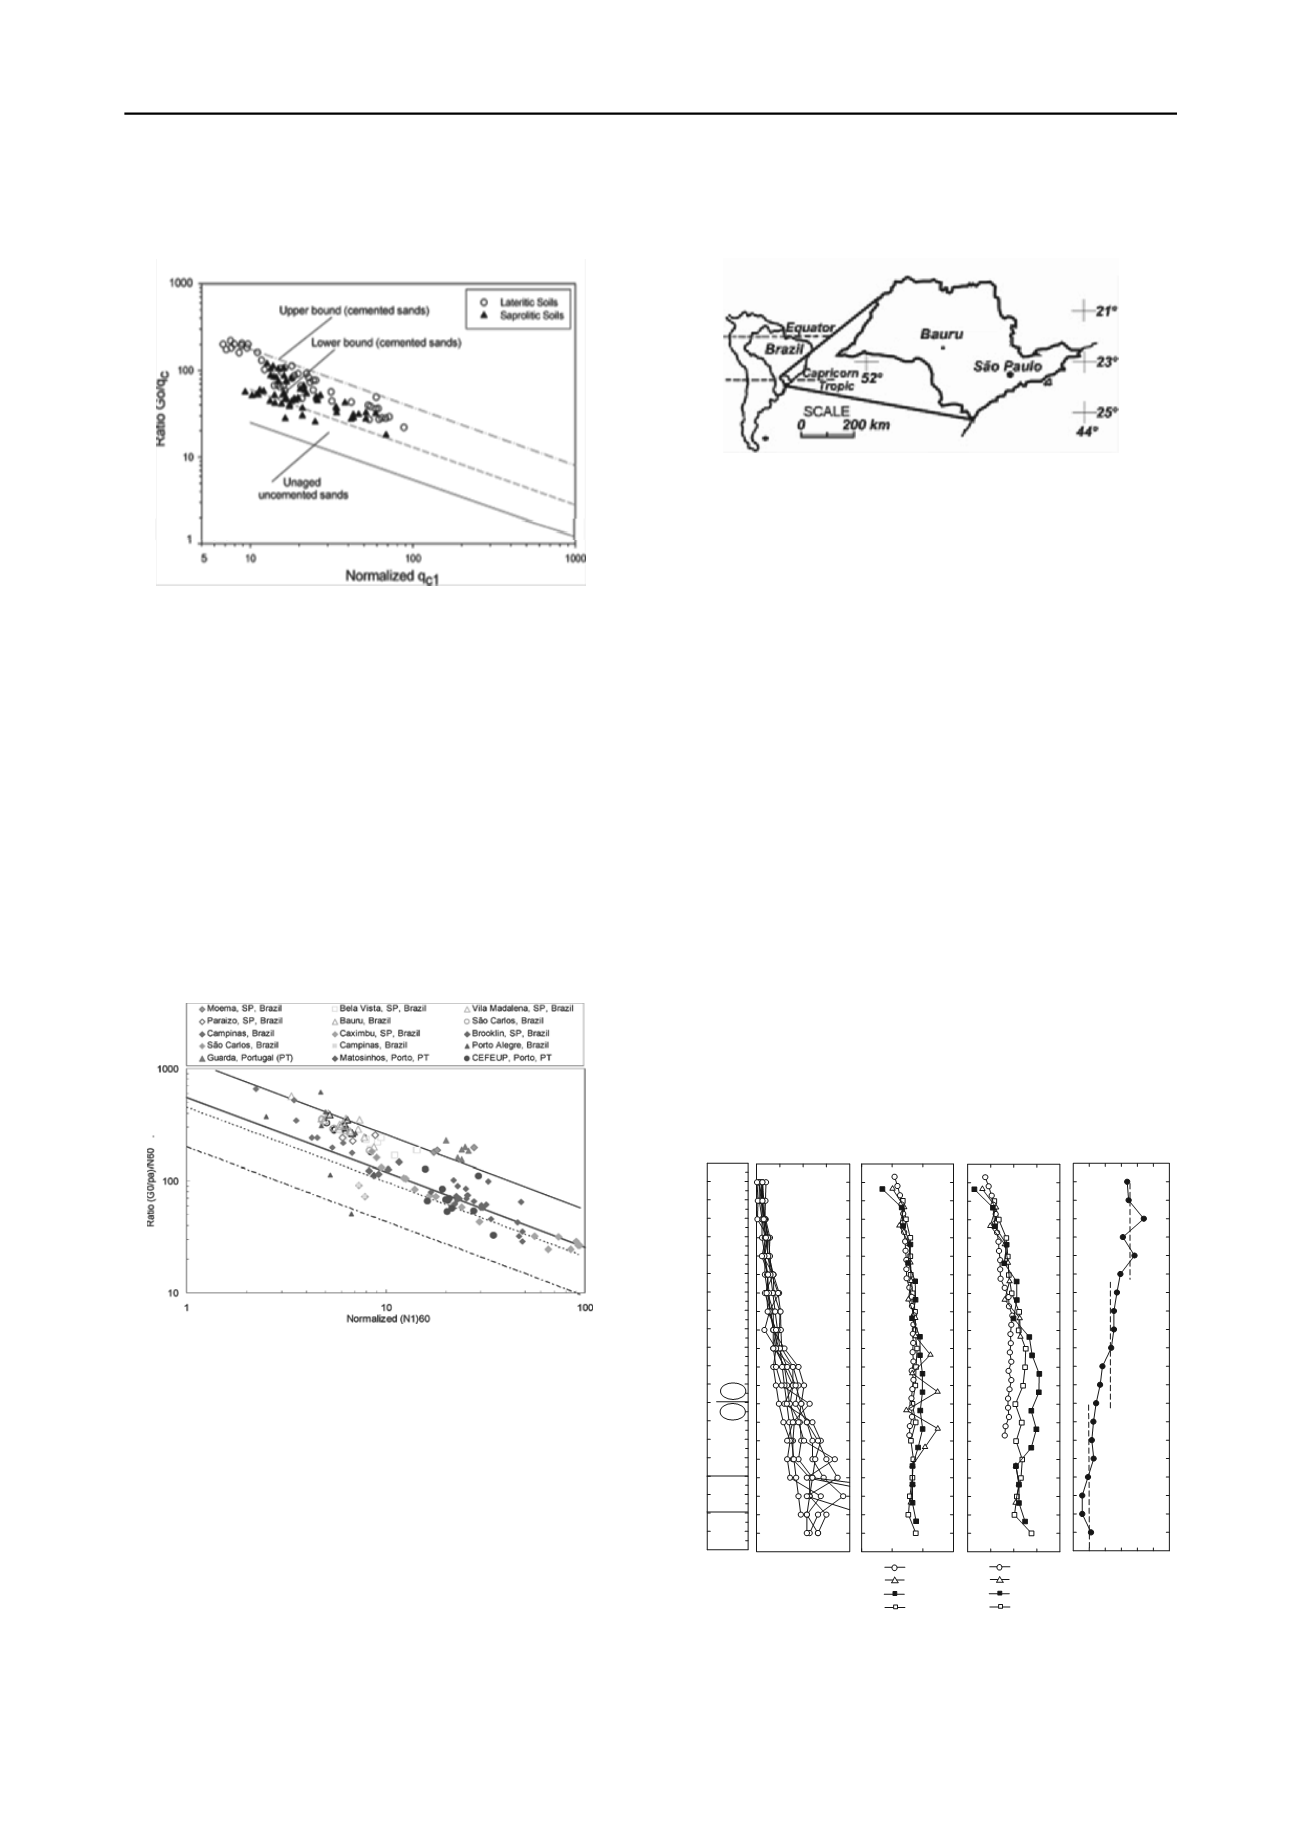
The results are in agreement with the propositions of Schnaid et
al. (2004). They also observed that lateritic soils tends achieve a
higher Go/qc ratio than the saprolitic soils.
Figure 1. Relationship between Go and qc (Giacheti & De Mio, 2008).
2.3
Go/N Ratio
Schnaid et al. (2004) suggested that the N values from SPT test
can also be combined with Go, using the Go/N ratio, to help
assessing the presence of bonding structure. This approach is
presented in Figure 2. Viana da Fonseca & Coutinho (2008)
included data from experimental sites from Portugal in this
figure. These authors pointed out that the bonded structure have
a marked effect on the behavior of residual soils, with a Go/N
values considerably higher than those observed in cohesionless
materials. Lines are also shown in Figure 3 to define the upper
and lower bounds for cemented and uncemented sands.
Similarly to what has been presented by Giacheti & De Mio
(2008) for tropical soils based on SCPT data, the
interrelationship between small strain stiffness (Go) and N value
could be used to identify different soil behavior using the
seismic SPT similarly to the SCPT.
Figure 2. Relationship between Go and N
60
(Schnaid et al 2004,
completed by Viana da Fonseca & Coutinho, 2008).
3 STUDIED SITE
3.1
The site
The Unesp experimental research site is located inland of the
State of São Paulo, Brazil, in the city of Bauru (Figure 3).
Several site characterization campaigns including SPT, DMT,
PMT, CPT, SCPT, cross-hole and down-hole tests were
previously carried out at the site. A sample pit was excavated to
retrieve disturbed and undisturbed soil blocks to be tested in the
laboratory to characterize the soils and to determine
geotechnical properties.
The subsoil is a sandy soil where the top 13 m has lateritic
soil behavior (LA’) overlaying a soil of non-lateritic behavior
(NG’) derived from weathering of Sandstone rock. The MCT
Classification System proposed by Nogami & Villibor (1981)
for tropical soils was used to define and classify the soils with
regards to its lateritic behavior.
Figure 3. Bauru city, where the studied site is located.
3.2
SPT and seismic testing data
The typical soil profile for the studied site was defined based on
the SPT tests and it is presented in Figure 4.a, together with N
values correct by 60% efficiency (N
60
) for all SPT tests (Figure
4.b). The shear wave velocities (Vs) were determined with
cross-hole, down-hole and SCPT tests (Figure 4.c). Total mass
densities were obtained from undisturbed soil samples collected
in a sample pit excavated at the site. They were used to
calculate Go values based on Elastic Theory and the data are
presented in Figure 4.d.
An average Go/N
60
ratio for every one meter depth was
calculated, so the Go
avr
/N
60avr
values
versus
depth are presented
in Figure 4.e. The criteria to calculate this ratio was averaging
Go and N
60
from all the tests and after that calculating the
average ratio with the closest depth from Go and N
60
.
Site variability can be assessed based on N
60
and Vs values
and these data indicate that the site is quite variable. Giacheti at
al (2003) discussed variability for this site based on several CPT
tests. They also concluded that the site is variable and test data
can be affected by suction and cementation. The authors pointed
out that the SCPT1 shows the presence of a region with low qc
and high R
f
between around 10 and 16 m depth. These data are
quite different from those recorded with the SCPT2 test, so Vs
values were not considered to calculate Go for this portion of
the soil profile for the SCPT1 test. This variation is probably
related to the morphogenetic and pedogenetic processes and
probably reflects different degrees of cementation in the profile.
N 60
0 10 20 30 40
Depth (m)
0
1
2
3
4
5
6
7
8
9
10
11
12
13
14
15
16
17
18
19
20
21
LA'
NA'
SPT profile
1
2
3
1-Red clayey fine sand
2-Red clayey silty fine sand
3-Red clayey fine sand
(b)
(a)
SM - SC
G o (MPa)
0 100 200 300 400 0 10 20 30 40 50 60
CH1
SCPT1
SCPT2
DH
Go avr / N 60avr
(d)
(e)
V s (m/s)
0 200 400 600
(c)
CH1
SCPT1
SCPT2
DH
Figure 4. SPT and seismic testing data and Go/N
60
for the studied site.
3.3
The Go/N ratio
It can be observed in Figure 4.e that the average Go/N
60
tends
do decrease with depth, with an average value equal to 35


