537
Technical Committee 102 /
Comité technique 102
between 1 and 6 m depth, 23 between 6 to 13 m depth and 10
below 13 m depth. These results indicate that Go/N
60
ratio is
higher in the lateritic soil layer (1 to 13 m depth) and tends to
decrease as the residual soil is less developed.
The average Go and N
60
values for the study site were
plotted in the Go/N
60
versus
(N
1
)
60
chart (Figure 5). Almost all
the data points are in the upper bound for cemented sands which
indicates that the bonded structure of tropical sandy soils
produces Go/N
60
that are systematically higher than those
measured in cohesionless soils. It is also interesting to note in
Figures 4.e that the lateritic soils (G
0
/N
60
=35 to the upper
portion and 23 to the lower portion) present a higher
cementation than the saprolitic soils (average G
0
/N
60
=10).
These results are similar to what had been presented by Giacheti
& De Mio (2008) based on Go/qc from SCPT test (Figure 1)
and indicate the use of the ratio between the small strain
stiffness (Go) and an ultimate strength (N or qc) to identify
unusual soil behavior and degree of evolution of residual soils.
Normalized (N
1
)
60
1
10
100
Ratio (Go/pa)/N
60
10
100
1000
Unaged
uncemented sands
Upper bound
(cemented geomaterials)
Lower bound
(cemented geomaterials)
Lateritic Soils
Saprolitic Soils
Figure 5. Relationship between Go and N
60
for the studied site.
4 THE SEISMIC SPT TEST
4.1
Principle
It is possible to incorporate the shear wave velocity (Vs)
measurements during the SPT test applying the up-hole
technique. This approach has been used in the past and it is
recently presented in detail by Bang & Kim (2007). This hybrid
test allows measuring the SPT N value together with Vs (so Go)
at the same time and in the same borehole. For each sampler
depth (usually at every meter) a seismic wave is generated and
it can be recorded on the ground surface. A schematic
representation of the S-SPT test is show in Figure 6.
Case with
geophones
H1
H2
H3
Hi
DAQ
System
Manual SPT Equipment
Trigger &
Anvil
L1
L2
L3
Li
1
2
3
i
Figure 6. Schematic representation of an S-SPT test and a seismic
refracted path (adapted from Bang & Kim, 2007 by Pedrini et al, 2012).
The test equipment is the same currently used for the SPT
test. An arrangement of transducers (usually geophones) placed
in appropriate boxes on the ground surface, a triggering system
and the seismic source, which is the SPT sampler itself, are
added for the seismic SPT test.
4.2
Vs from the S-SPT test
Determining Vs from the S-SPT test data is not straightforward.
Bang & Kim (2007) described two methods: DTR (delay time
between serial receivers) and DTS (delay time between serial
sources). Pedrini (2012) suggested using the DTS method. In
this method, the time interval of the S waves arrival for each
sample depth in which the test was carried out is determined
identifying the exact moment of the first arrival time plotting
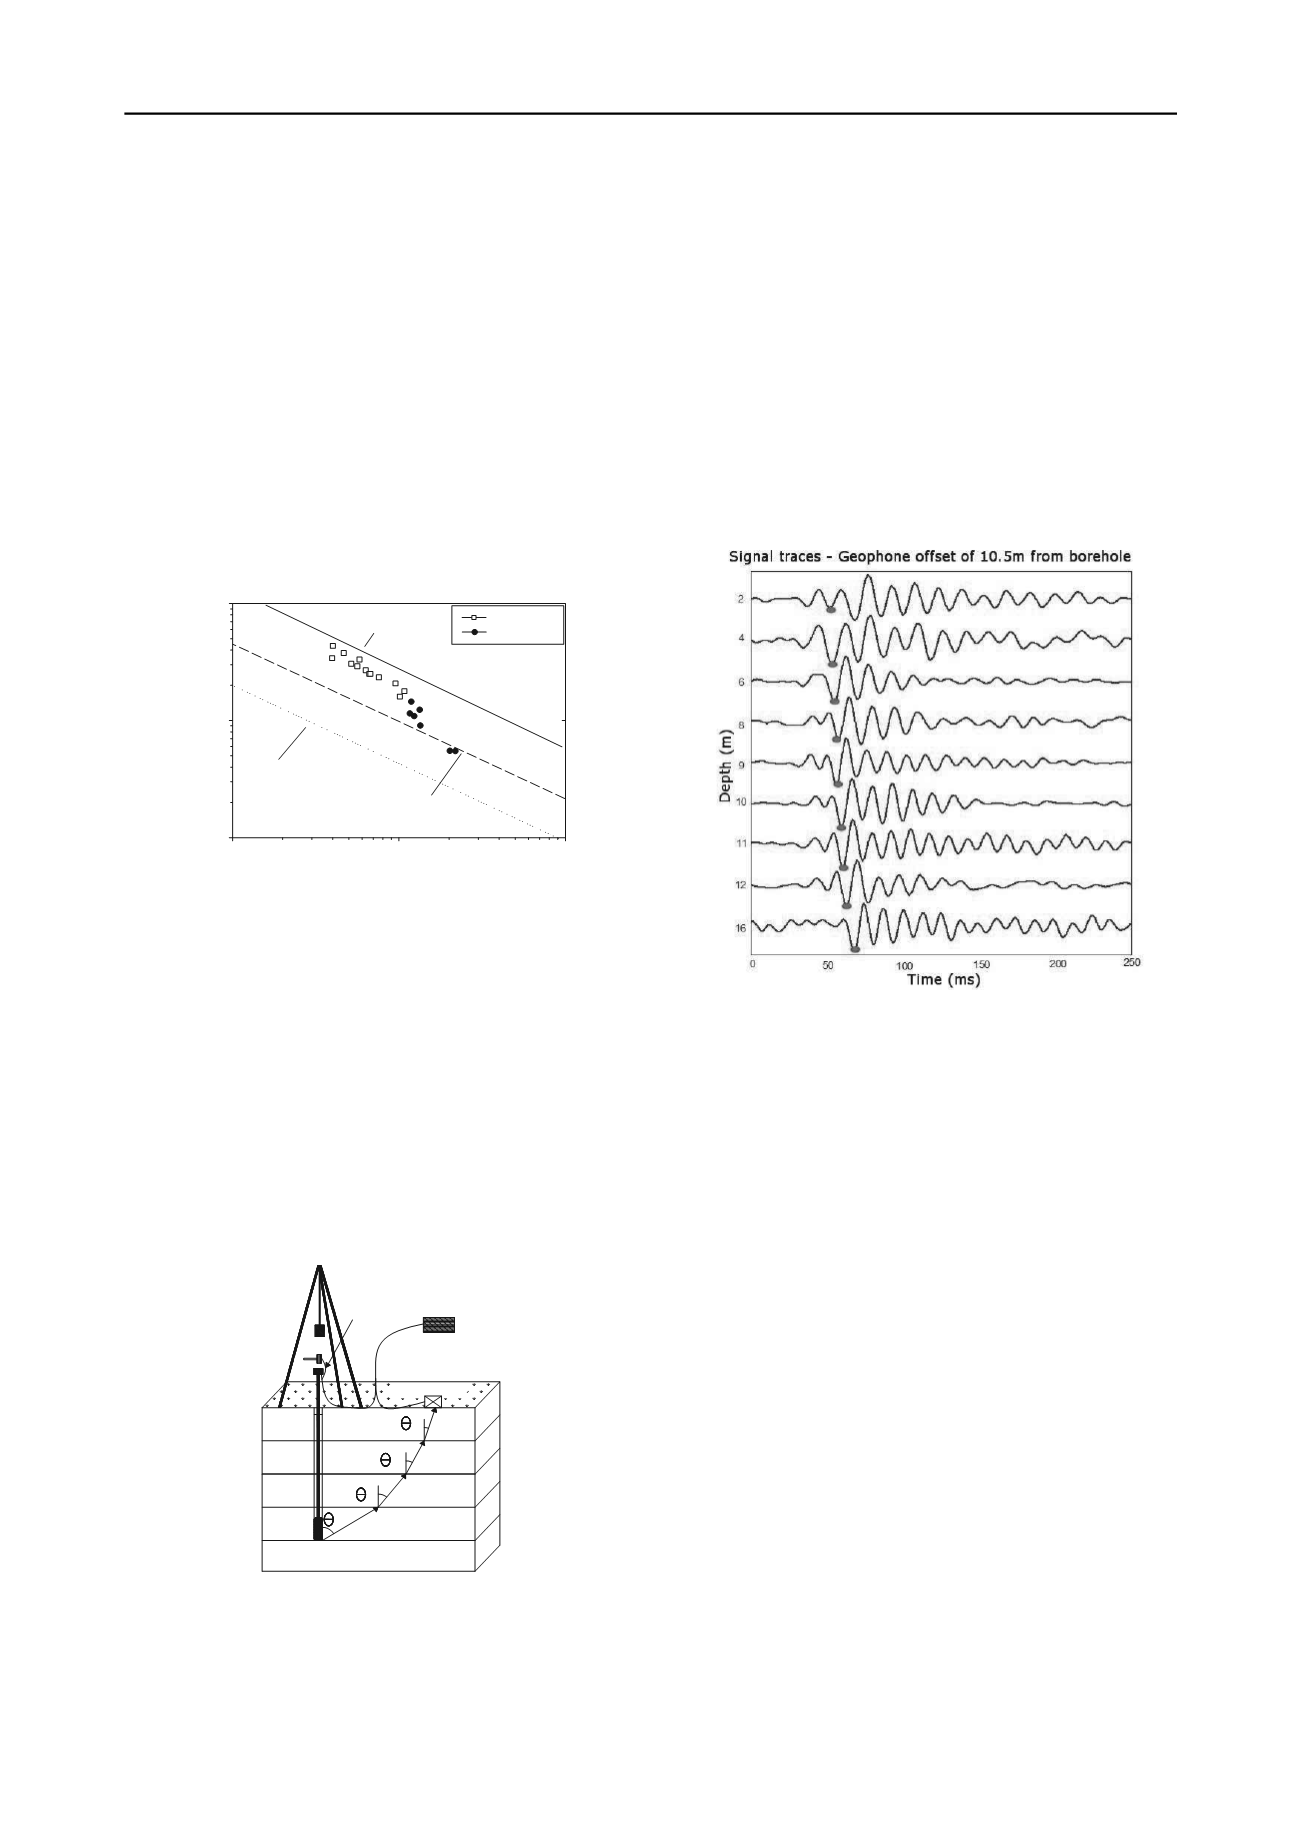
the wave receptions generated at different depths. Figure 7
shows a typical wave recordings profile as well as the point of
the first S wave arrival. Another important aspect is the
geometry. Bang & Kim (2007) recommend that Snell’s Law
(the refraction and reflection during the propagation of waves in
stratified layers of different densities) should be taken into
account when determining the refracted wave path.
Figure 7. Profile of seismic wave and the identification of the common
arrival point of the S waves (Pedrini et al, 2012).
The refracted ray pathway calculated based on Snell’s Law
depends on various wave velocities and it can be determined by
considering two conditions: the Snell’s law and a geometrical
criteria. The following assumptions must be done: 1) each
sample layer is equal to the depth where the SPT test was
carried; 2) each layer is homogeneous and the propagated wave
velocity is assumed constant in each layer as show in Figure 6.
An iterative method must be used to solve the equation system
and determine the length (L) that the wave propagates in each
soil layer. Details can be found in Bang & Kim (2007).
4.3
The S-SPT equipment
The system for carrying out S-SPT tests and the method of
analysis were implemented and described by Pedrini (2012).
The main characteristics of this system are presented by Pedrini
et al (2012) and will be summarized herein.
Bang & Kim (2007) used the drop of the SPT weight as the
source to generate waves while Pedrini (2012) used a 2 kg
sledgehammer. The triggering device was digital, with one
terminal (positive or negative) fitted into the anvil head and the
other attached to the sledgehammer.
Two geophones were installed inside of six boxes placed on
the ground, one vertical and other horizontal oriented in a radial
pattern. A National Instruments, model NI-USB-6353, data
acquisition system was used. It has 16 bits resolution, 32 single
ended channels and 16 differential channels, a digital and
analogue trigger and a receiving rate of 1.25 ms/s. Software in
the Labview and Matlab platforms were developed by Pedrini
(2012) to trigger, capture the waves, signal processing,
represent the traces, analyzing the recorded data and calculating
the velocities.


