540
Proceedings of the 18
th
International Conference on Soil Mechanics and Geotechnical Engineering, Paris 2013
Natural Water Content, %
10
100
Compression Index, C
c
0.1
1
Idku
Metobus
Dammietta3
Dammietta4
Port Said 2
El-Gamil
Dammietta2
C
c
=0.1w
C
c
=0.005w
C
c
=0.003w
C
c
=4x10
-6
w
2.85
Volumetric Strain at
'
vo
,
vo
, %
0 1 2 3 4 5 6 7 8 9 10
Overconsolidation Ratio, OCR
0.0
0.5
1.0
1.5
2.0
2.5
3.0
Idku
Metobus
Dammietta3
Dammietta4
PortSaid2
El-Gamil
Dammietta2
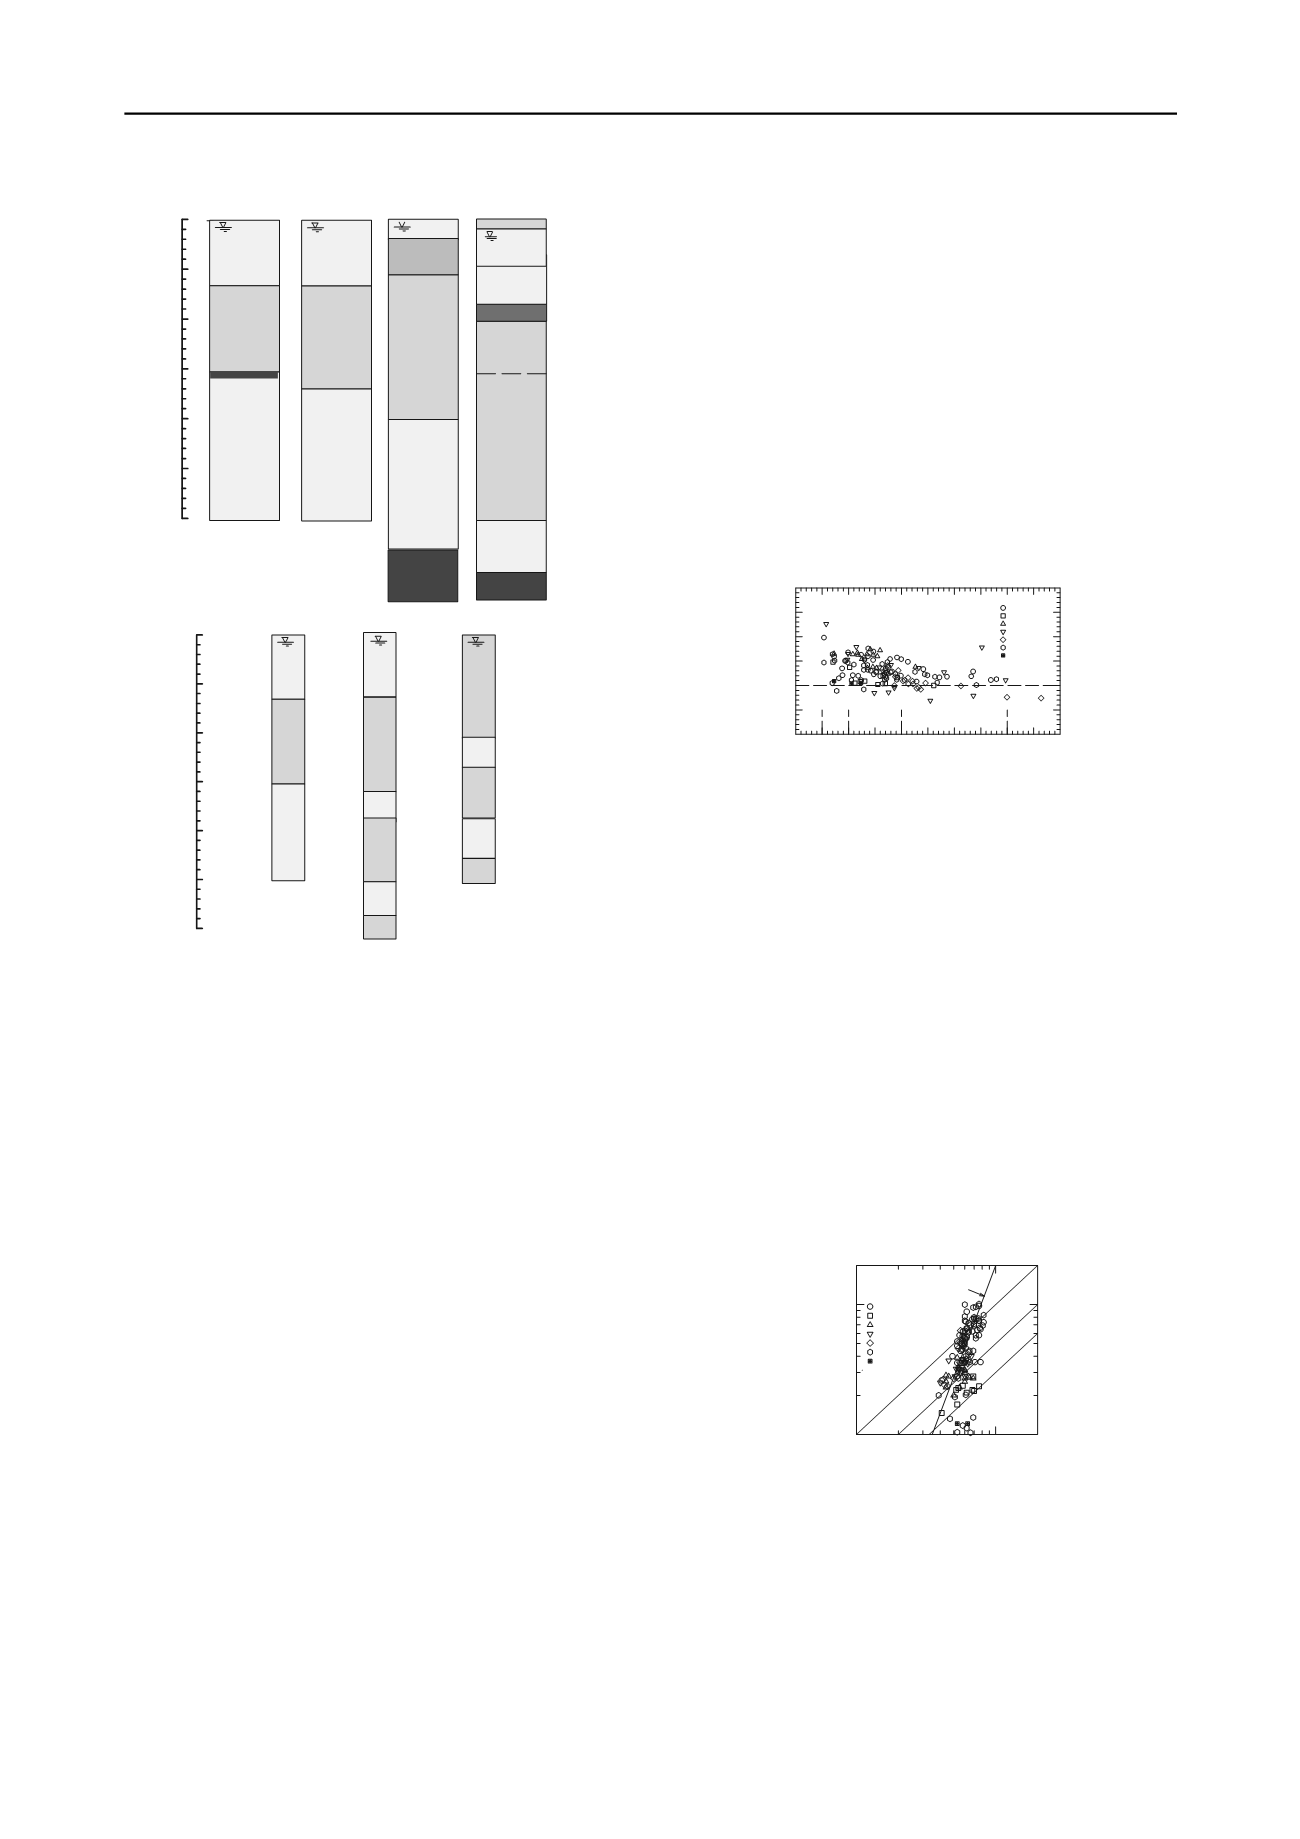
SQD Scale
A B C
D
E
Depth, m
0
10
20
30
40
50
60
Silty Sand
Soft to
Firm Clay
Sand
with Silt
Occasionaly
interbeded by
Hard Clay
ELGamil
Silty
Sand
Alternating
Soft to
Med. Stiff
Clay,
Organic Silt
& Silty Sand
Sand
with
Silt
Idku
Limemud
Silty
Sand
Soft to
Med. Stiff to
Very Stiff
Clay,
Interbeded
with Very
Stiff Peat
Sand
with
Silt
Metobus
Soft to
Firm Clay
Port Said 2
Soft Clay
Silt/
Silty Sand/
Clay
Stiff Clay
Silty Sand
Sand - Occas.
Silt and Clay
Silt
Firm to
Stiff Clay
Silty Sand
Stiff Clay
Depth, m
0
10
20
30
40
50
60
Silty
Sand
Soft
to
Firm
Clay
Silty
Sand
Damietta 2
Very
Soft to
Medium
Stiff
Clay
Silty
Sand
Stiff
to
Hard
Clay
Silty
Clayey
Sand
Damietta 4
Hard
Clay
Very
Soft to
Medium
Stiff
Clay
Silty
Clayey
Sand
Stiff
to
Hard
Clay
Silty
Clayey
Sand
Damietta 3
Hard
Clay
Silty
Clayey
Sand
Figure 1. Stratigraphy of the soil formations in the seven sites.
3 COMPRESSIBILITY PARAMETERS FROM
OEDOMETER TESTS
3.1. General
The results of total 125 consolidation tests were used in this
study. The tests were carried out on clay “undisturbed” samples
that were collected by means of stainless steel thin wall Shelby
tubes with cutting edge sharpened to approximately 5
o
.
Incremental loading procedure was utilized with a load
increment ratio of 2. End Of Primary (EOP) consolidation was
determined for each load increment using the Taylor method.
EOP void ratio versus logarithm of effective vertical pressure
(e-log
’
v
) curves were plotted for each test.
3.2. Overconsolidation Ratio
The overconsolidation ratio, OCR, is defined as the ratio
between the preconsolidation or yield pressure,
’
p
, to in situ
effective overburden pressure,
’
vo
. The
’
p
is the pressure that
distinguishes between low compressibility in the recompression
range and the high compressibility in the compression range.
There are several mechanisms for a deposit to demonstrate a
’
p
(Jamiolkowski et al., 1985 and Mayne et al., 2009). Those
mechanisms include; decrease in vertical effective stress,
freeze-thaw cycles, repeated wetting-drying, tidal cycles,
earthquake loading, desiccation, aging, cementation or
geotechnical bonding. The decrease in effective stress could be
caused by; mechanical removal of overburden, overburden
erosion, rise in sea level, increased groundwater elevations,
glaciation, and mass wasting. The conventional and most
common Casagrande method is used to determine
’
p
from the
EOP e-log
’
v
curves from the Oedometer tests carried out.
Sample quality was evaluated on the basis of the magnitude
of the volumetric strains,
vo
, during reconsolidation to
’
vo
in
oedometer tests as suggested by Andresen and Kolstad (1979).
The Sample Quality Designation (SQD) scale using
vo
suggested by Andresen and Kolstad (1979) and modified by
Terzaghi et al. (1996) is used in this paper. Figure (2) shows the
OCR values in this study versus
vo
. Shown also on the plot, is
the above mentioned SQD scale. The scale suggests that the
majority of samples have quality B to C. Such sample qualities
correspond to verbal scale of very good to good samples.
The OCR values for the clay are in the range of 1 to 2. It
should be noted that OCR values might be influenced by sample
disturbance. As sample disturbance increases (i.e.
vo
increases),
the OCR value decreases due to the de-structuring of the samples
during sampling. One possible major source for sample
disturbance in Nile Delta deposits is the natural gas exsolution in
the pore water (Hight et al., 2000). The OCR values, for the very
few tests, that are less than 1 were corrected to 1 for use in
evaluations and correlations developed in this study.
Fig. 2 Overconsolidation ratio (OCR) versus
vo
as a measure of SQD
3.3. Compression Indices and Moduli
The compression, C
c
, and re-compression, C
r
, indices were
calculated for each test as the slopes of the e-log
’
v
curve in
the normally consolidated and the re-compression ranges,
respectively. The recompression index, C
r
, was calculated as the
average slope of the unloading-reloading cycle of e-log
’
v
curve between vertical effective stress value of twice of the
preconsolidation pressure,
’
p
, and effective overburden
pressure,
’
vo
or the average slope of the unloading curve from
consolidation pressure of 3200 kPa.
Compression index values in this study are plotted in Figure (3)
versus natural water content, the Terzaghi et al. (1996) plot for
filling and reference. The water content is a major variable as it
reflects how much water held in the deposit to be squeezed out
upon the increase in effective stress. As expected, the data show a
band that compares relatively well with data from all over the
world as collected originally by Terzaghi et al. (1996). The overall
average of ratio of re-compression to compression indices C
r
/C
c
is
calculated to be about 0.1.
Figure.3 Data of this study on the compression index versus natural water content
Terzaghi et al (1996) relationship
Constrained modulus is another form of compressibility
parameter instead of the recompression or compression indices.
The following expression is used to estimate the tangent
constrained modulus:
M=
’
v
/
= 2.3(1+e)
’
v
/C
c
(1)
The general definition of constrained modulus in Equ. (1) is
used in the literature (e.g. Kulhawy and Mayne 1990). There are
several definitions for the constrained modulus depending on
which
’
v
and which index, C
c
or C
r
, used in Equ. (1). It is
expected that the modulus in the compression range is different


