549
Technical Committee 102 /
Comité technique 102
in the same age in order to make the results comparable, without
being interrupted by variation of the soil mix dynamic
properties. Two scaled near field shaking events including
Kobe, 1995, Northridge, 1994, and two scaled far field
earthquakes including El Centro, 1940, and Hachinohe, 1968
are adopted. The characteristics of the mentioned benchmark
earthquakes are summarised in Table 1. Displacement
transducers (levels 3, 5, 7, 11, 13, and 15) and accelerometers
(at levels 3, 5, 7, 9, 11, 13, and 15) were installed on the
structure in order to monitor the dynamic response of the
structure and to primarily measure the structural lateral
displacements. The recorded accelerations can be used to check
the consistency and accuracy of obtained displacements through
a double integration in time domain. The final setup of the tests
for the end-bearing pile foundation system on the shaking table
shown in Figure 1.
T
d e
ake b
ns
P
M )
Dur
S)
is
able 1.
Utilise arthqu ase motio
Earthquake
Year
GA (g)
w (R
ation (
Northridge
1994
0.843
6.7
30.0
Kobe
1995
0.833
6.8
56.0
El Centro
1940
0.349
6.9
56.5
Hachinohe
1968
0.229
7.5
36.0
3 DEVELOPMENT OF 3D NUMERICAL MODEL
Three-dimensional explicit finite-difference based program
called FLAC3D (Itasca 2009) has been employed to develop the
numerical model for the shaking table tests and to simulate the
response under the seismic loading. Three cases including
fixed-base conditions, the structure supported by shallow
foundations, and the structure supported by end-bearing pile
foundations have been modelled separately and the results are
compared. The dimensions of the numerical models were
chosen similar to the experimental tests. The reason for
choosing the soil deposit thickness of 30 m for the both
experimental and numerical models is that most amplification
occurred within the first 30 m of the soil profile, which is in
agreement with most modern seismic codes calculating local
site effects based on the properties of the top 30 m of the soil
pro
rid and
mo
e-field boundary
con
4.0
records and results in terms of maximum inelastic
eral deflections, determined for the three mentioned cases, are
recorded.
file (Rayhani and El Naggar 2008).
Experience gained from the parametric study helped to
finalise the adopted mesh size and the maximum unbalanced
force at the grid points to optimize the accuracy and the
computation speed simultaneously. The numerical g
del components in FLAC3D are shown in Figure 2.
Adjusting the boundary conditions, in the static analysis in
which the system is under the gravity loads only, the bottom
face of the mesh is fixed in all directions, while the side
boundaries are fixed in the horizontal directions. During the
dynamic time-history analysis, the earthquake acceleration is
applied horizontally at the entire base, while fre
ditions are assigned to the side boundaries.
Solid elements are used to model the soil deposits, and
Mohr-Coulomb failure criterion is adopted. In addition,
Hysteretic damping of the soil is implemented using the built-in
tangent modulus function as developed by Hardin and Drnevich
(1972). The pile elements and superstructure are modelled with
solid elements considering elastic-perfectly plastic behaviour
with yielding criteria for the elements to control the possibly of
inelastic behaviour in both superstructure and piles. As a
calibration, a FLAC3D analysis was first conducted on a
cantilever pile while the pile was fixed at one end into ground
without the surrounding soil and the different lateral loads were
applied on the free end of the cantilever pile. The recorded
deflection from the FLAC3D model shows less than 2%
difference from analytical predictions, confirming the accuracy
of the model. It should be noted that using the structural
elements such as beam and shell elements in FLAC3D (version
) for modelling the superstructure increases the execution
time dramatically and leads to less accurate results.
Because of the different characteristics of the soil and the
superstructure/piles, sliding and separation may occur at the
soil–structure interfaces. Two sets of interface elements are
modelled in this study. For the shallow foundation case, the
interface elements are placed between the foundation and the
soil surface. However, for the pile foundation case, the interface
elements were attached to the outer perimeter of the piles. It
should be noted that in the pile foundation case, there is no
interface or attachment between the foundation and the surface
soil as some gap in the shaking table tests is considered to avoid
any pile-raft behaviour. Therefore, there is not any direct stress
transfer between the foundation slab and the subsoil in the pile
foundation cases. The interfaces were modelled as linear
spring–slider systems, while the shear strength of the interfaces
was defined by Mohr–Coulomb failure criterion. The lateral and
axial stiffness of the interface elements are estimated for both
sets separately based on the recommended method given by
Itasca (2009) to ensure that the interface stiffness has minimal
influence on system compliance. Finally, fully nonlinear time-
history analysis is conducted under the influence of the scaled
arthquake
e
lat
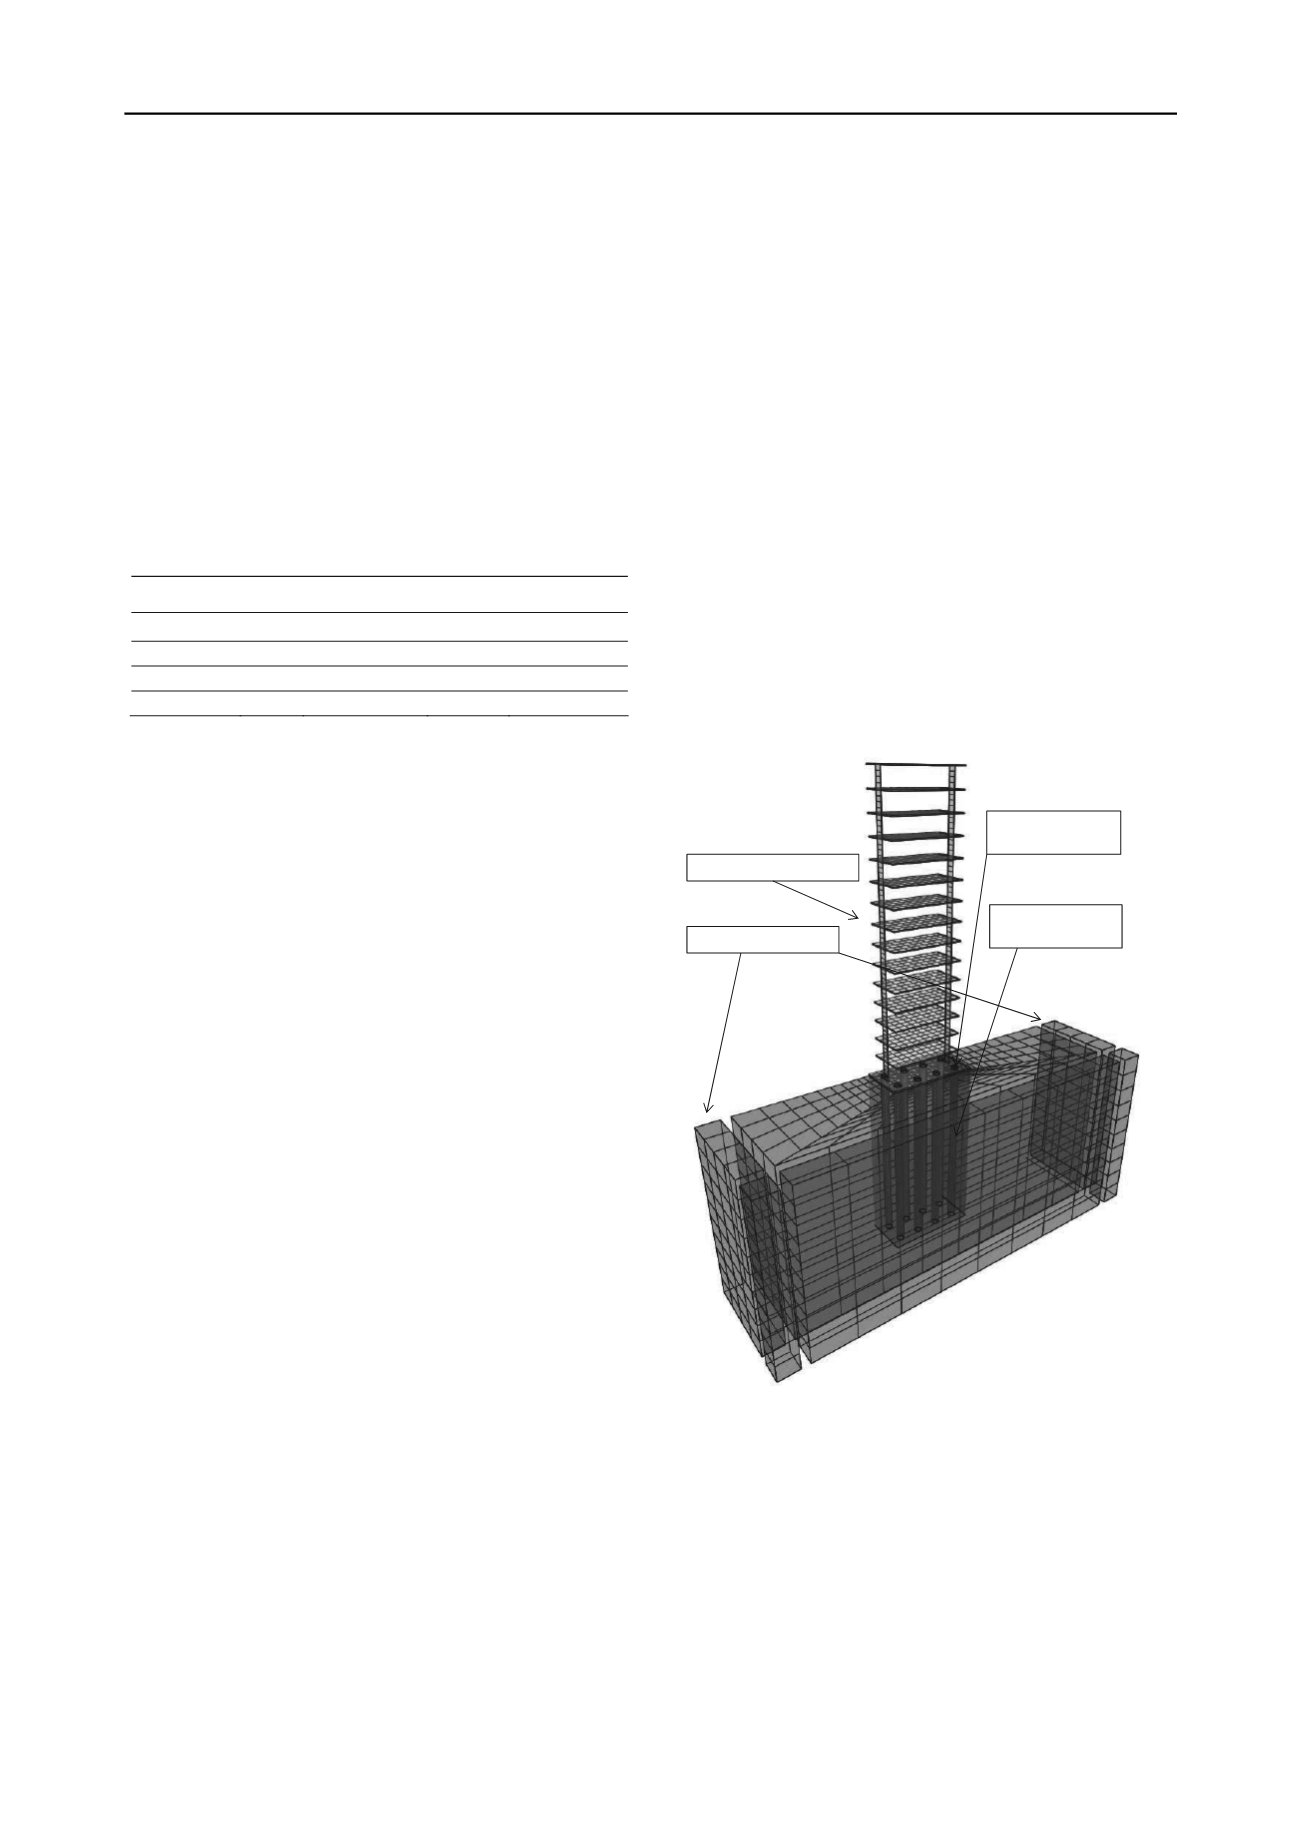
15‐storey model structure
Free field boundaries
Interfaces between
piles and soil
Connection of piles
to the base plate
Figure 2. Numerical grid and model com
structure with end-bearing pile foundation
ponents in FLAC3D for the
with acceptable accuracy and is
4 RESULTS AND DISCUSSION
The average values of the 3D numerical predictions versus
experimental shaking table results for the maximum lateral
displacements of the fixed-base, shallow foundations, and end-
bearing pile foundations were determined and compared in
Figure 3. Evaluation of the predicted and observed values of the
maximum lateral displacements indicates that the trend and the
values of the 3D numerical predictions are in a good agreement
and consistent with the experimental shaking table test results.
Therefore, the 3D numerical model can replicate the behaviour
of the soil-pile-structure system


