552
        
        
          Proceedings of the 18
        
        
          th
        
        
          International Conference on Soil Mechanics and Geotechnical Engineering, Paris 2013
        
        
          The complex investigations at the location have been made,
        
        
          including borings and sampling, laboratory tests, water level
        
        
          measurements and monitoring of church wall movements.
        
        
          The thorough engineering geology investigations were also
        
        
          performed, and, in order to obtain reliable geotechnical model
        
        
          of landslide, the so-called RNK method was used.
        
        
          2 RNK METHOD - FUNDAMENTAL NOTIONS AND
        
        
          BASIC DEFINITIONS
        
        
          The
        
        
          RNK method
        
        
          (RNK-the acronym in Croatian language)
        
        
          or
        
        
          the


            Reference Level of Correlation Method


          (Ortolan 1996) is a
        
        
          fully developed method for engineering-geological and
        
        
          geotechnical modelling. It is primarily intended for the landslide
        
        
          recognition and the analysis of the slope stability of soils and
        
        
          soft rock formations. However, the “sedimentation fingertip”
        
        
          obtained by geotechnical correlation column can be also used
        
        
          for reliable association of other test results in clayey sloppy
        
        
          profiles (Ivsic et al., 2005)


            The RNK (Reference Level of Correlation)


          is defined as an
        
        
          unequivocally recognizable and visually identifiable (or
        
        
          graphically defined!) bedding plane or any other reference plane
        
        
          within a structural feature, in relation to which an altitude of all
        
        
          studied profiles can be unambiguously defined, with individual
        
        
          point analysis of any material property. Such plane is a part of a
        
        
          single vertical lithostratigraphical i.e. engineering geological
        
        
          and/or geotechnical sequence (engineering-geological and/or
        
        
          geotechnical correlation column).
        
        
          The importance of correlation for the slip-surface and/or
        
        
          slip-zone determination is emphasized by Ortolan (1990).
        
        
          The plasticity index has proven to be a reliable strength
        
        
          indicator for cohesive materials (Ortolan 1996, Ortolan &
        
        
          Mihalinec 1998, Ortolan et al., 2009). The highest values of
        
        
          plasticity index, but also the liquid limit, correspond to the
        
        
          lowest expected values of friction angle. This fact allows a new
        
        
          approach to exact geotechnical modelling. Therefore, testing of
        
        
          Atterberg plasticity limits on point samples can be
        
        
          recommended for the identification of zones with lowest shear
        
        
          strengths. The sample length should not exceed 10cm
        
        
          (sometimes it should be aslittle as several centimetres, and even
        
        
          several millimetres). The sampling interval of 0.5–1.0m is
        
        
          usually considered sufficient.
        
        
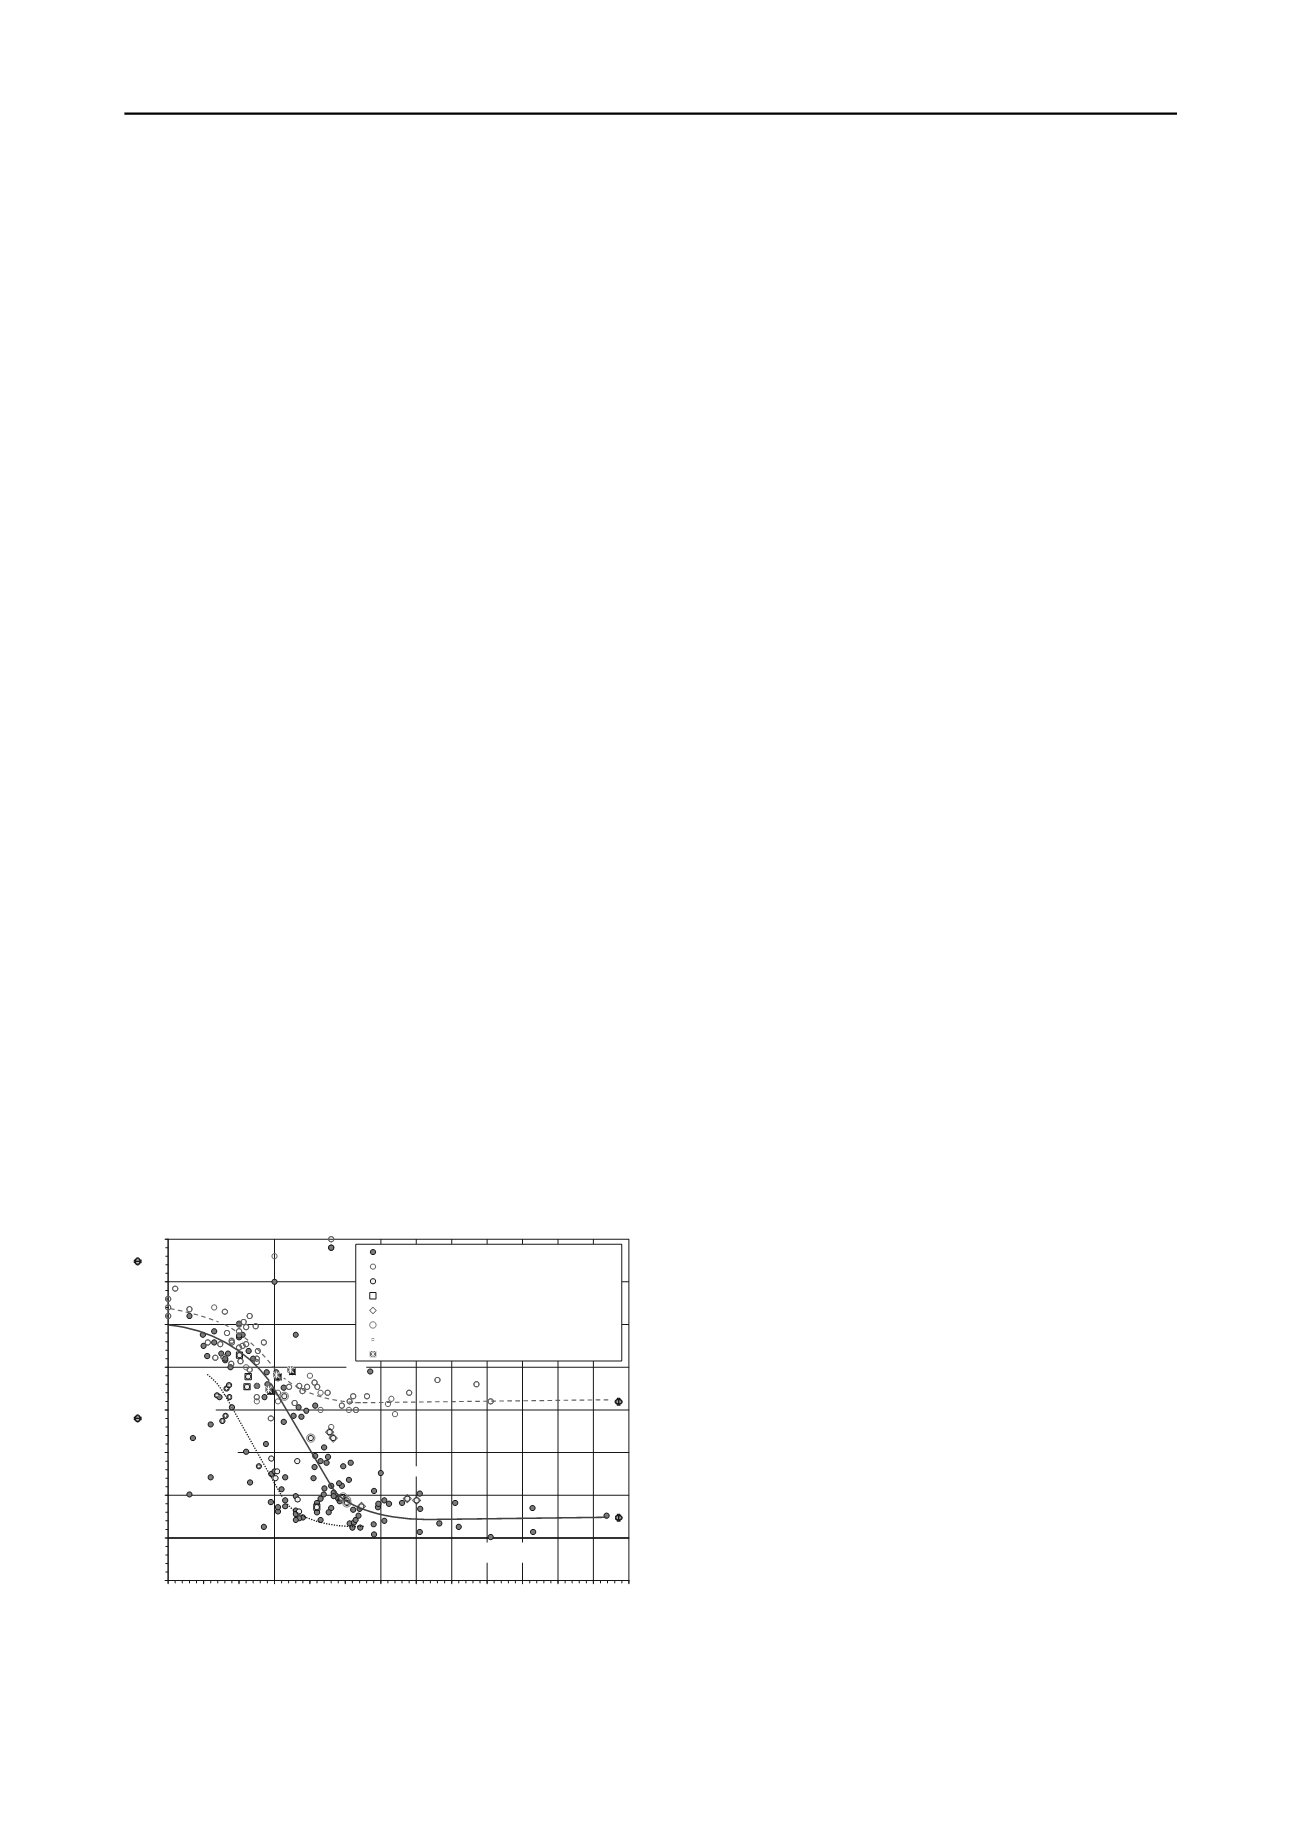
          The correlation between the plasticity index and angle of
        
        
          internal friction is given in Figure 3, as developed by various
        
        
          authors, systemized by Ortolan & Mihalinec (1998) and
        
        
          enriched by new carefully obtained data.
        
        
          46,0
        
        
          119
        
        
          118
        
        
          117=120
        
        
          116
        
        
          111
        
        
          108
        
        
          106
        
        
          104
        
        
          102
        
        
          101
        
        
          100
        
        
          96
        
        
          95
        
        
          92
        
        
          91
        
        
          88
        
        
          68
        
        
          87
        
        
          54
        
        
          115
        
        
          110
        
        
          89
        
        
          90
        
        
          51
        
        
          84
        
        
          19
        
        
          74
        
        
          7
        
        
          82
        
        
          25
        
        
          72
        
        
          26
        
        
          71
        
        
          70
        
        
          14
        
        
          73
        
        
          1
        
        
          75
        
        
          76
        
        
          24
        
        
          3
        
        
          22
        
        
          18
        
        
          31
        
        
          59
        
        
          21
        
        
          30
        
        
          44
        
        
          49
        
        
          9
        
        
          20
        
        
          8
        
        
          36
        
        
          33
        
        
          35
        
        
          69
        
        
          16
        
        
          37
        
        
          77
        
        
          60
        
        
          17
        
        
          80
        
        
          47
        
        
          2
        
        
          32
        
        
          15
        
        
          45
        
        
          48
        
        
          46
        
        
          6
        
        
          83
        
        
          67
        
        
          61
        
        
          42
        
        
          13
        
        
          38
        
        
          50
        
        
          53
        
        
          56
        
        
          52
        
        
          55
        
        
          98
        
        
          58
        
        
          62
        
        
          93
        
        
          39
        
        
          65
        
        
          11
        
        
          12
        
        
          66
        
        
          64
        
        
          40
        
        
          78
        
        
          34
        
        
          4
        
        
          29
        
        
          94
        
        
          41
        
        
          79
        
        
          23
        
        
          5
        
        
          10
        
        
          27
        
        
          28
        
        
          43
        
        
          63
        
        
          86
        
        
          85
        
        
          97
        
        
          99
        
        
          103
        
        
          112
        
        
          113
        
        
          105
        
        
          107
        
        
          109
        
        
          114
        
        
          0
        
        
          5
        
        
          10
        
        
          15
        
        
          20
        
        
          25
        
        
          30
        
        
          35
        
        
          40
        
        
          0 10 20 30 40 50 60 70 80 90 100 110 120 1
        
        
          PLASTICITY INDEX -


            PI (%)


          PEAK
        
        
          -


            P


          OR RESIDUAL FRICTION ANGLE
        
        
          -


            R


            (


          30


            O


            )


          Residual friction angle (Ortolan & Mihalinec, 1998)
        
        
          Peak friction angle  (Ortolan & Mihalinec, 1998)
        
        
          Residual friction angle (1998-2006)
        
        
          Landslide Hospital Merkur in Zagreb ( 2005/2006)
        
        
          Landslide Jarpetar near Buje -  Istra (2002)
        
        
          Landslide Česmički west in Zagreb (2002)
        
        
          Landslide Zalesina: Triassic clays and shales (Ortolan, 1996)
        
        
          Residual friction angle: Landslide Gorica Svetojanska
        
        
          Very sensitive clays:
        
        
          4-8 (OTAWA-KANADA: 8)
        
        
          Cucaracha
        
        
          Shale: (15)
        
        
          Allophane:
        
        
          JAVA
        
        
          Halloasyte:
        
        
          JAVA
        
        
          Halloasyte
        
        
          (29-32):Clay fromCarboniferous
        
        
          Shales andMudstones
        
        
          (25-27):Materials
        
        
          ContainingHydrousMica
        
        
          SoftClays (47-49)
        
        
          (20-24):Materials containing
        
        
          montmorillonite
        
        
          (100-107):Triassic
        
        
          clays and shales


            P


            R


          Figure 3. Correlation between index of plasticity and angle of internal
        
        
          friction – both peak and residual.
        
        
          The following supporting documents are most often used in
        
        
          the study of landslides: general geological map of the wider area
        
        
          under study, geotechnical correlation column, and engineering-
        
        
          geological map with slip-plane contour lines and with clearly
        
        
          delineated slip areas and hydro-isohypses or hydro-isopiestic
        
        
          lines at the slip-plane level (Ortolan 1996, 2000).
        
        
          The


            geotechnical correlation column


          is a consistent
        
        
          engineering-geological and/or geotechnical soil model (design
        
        
          cross section) in which adequate parameters (defined in
        
        
          laboratory or in situ either by point method or continuously) can
        
        
          reasonably be allocated to every defined layer (and portions of
        
        
          such layers) along the entire height of the vertical sequence of
        
        
          formations covered by the study. From such geotechnical
        
        
          correlation column we may in principle differentiate zones of
        
        
          minimum residual shear resistance, with their thicknesses and
        
        
          continuities, but also layers with different moisture content,
        
        
          hydraulic conductivity, natural compaction, compressibility, etc.
        
        
          The engineering-geological and/or geotechnical correlation
        
        
          column of an analyzed area is the "key" to the interpretation of
        
        
          overall engineering-geological and/or geotechnical relationships
        
        
          in a required number of profiles selected at will for 2D and
        
        
          spatial analysis, which is especially significant in 3D analysis of
        
        
          stability.
        
        
          The consistent use of the RNK-method in the period from
        
        
          1995 to the present day has resulted in the elaboration of three-
        
        
          dimensional geotechnical models for some fifty landslides. In
        
        
          all of these cases the following parameters were successfully
        
        
          defined: sliding body geometry, pore pressures and shear
        
        
          strength parameters for materials along zones of minimum shear
        
        
          resistance. In combination with existing topographical
        
        
          documents, this enabled accurate stability analyses and
        
        
          definition of optimum improvement procedures. The Podsused
        
        
          landslide may be described as one of the most complex urban
        
        
          landslide projects in the world (Ortolan 1996, 2000). It is
        
        
          precisely on this project that the RNK-method has been
        
        
          developed in full detail, and the reliability of the model was
        
        
          confirmed with photogrammetric measurements (Ortolan et al.
        
        
          1995) as well as with three-dimensional stability analyses
        
        
          (Mihalinec & Stanić, 1991).
        
        
          Most of the studied landslides have been stabilized, in all
        
        
          cases with great success, and the supervisory work conducted
        
        
          during remedial works provided positive feedback information
        
        
          about the correctness of adopted engineering-geological and
        
        
          geotechnical landslide models, (e.g. at the Granice landslide;
        
        
          Jurak et al., 2004), and about reliability of the engineering-
        
        
          geological and geotechnical correlation column (design cross
        
        
          section). On some projects the reliability of the model was
        
        
          checked and confirmed by appropriate inclinometer, piezometer
        
        
          and benchmark measurements.
        
        
          3 DESCRIPTION OF THE LANDSLIDE AND GEO-
        
        
          TECHNICAL PROPERTIES OF MATERIALS
        
        
          The topographic presentation of the neighboring terrain in
        
        
          Gorica Svetojanska with the contour of the landslide is given in
        
        
          detailed engineering geology map of the area (Figure 4). Results
        
        
          of laboratory and in situ investigations, presented in form of
        
        
          geotechnical correlation column are presented in Figure 5.
        
        
          Plasticity chart with encircled critical geotechnical zone-2 is
        
        
          presented in Figure 6. Formations found on the landslide
        
        
          (calcitic clays and clayey marls) date back to the Pontian


            .


          4 ANALYSES
        
        
          4.1


            Wall movements


          The investigation program included the measurements of
        
        
          relative rotation of church walls using several horizontal and
        
        
          vertical tilt meters, and, also the change of crack widths during
        
        
          monitoring period (originally found cracks were 15-20mm
        
        
          wide). The particular results are shown in Figure 7.