553
Technical Committee 102 /
Comité technique 102
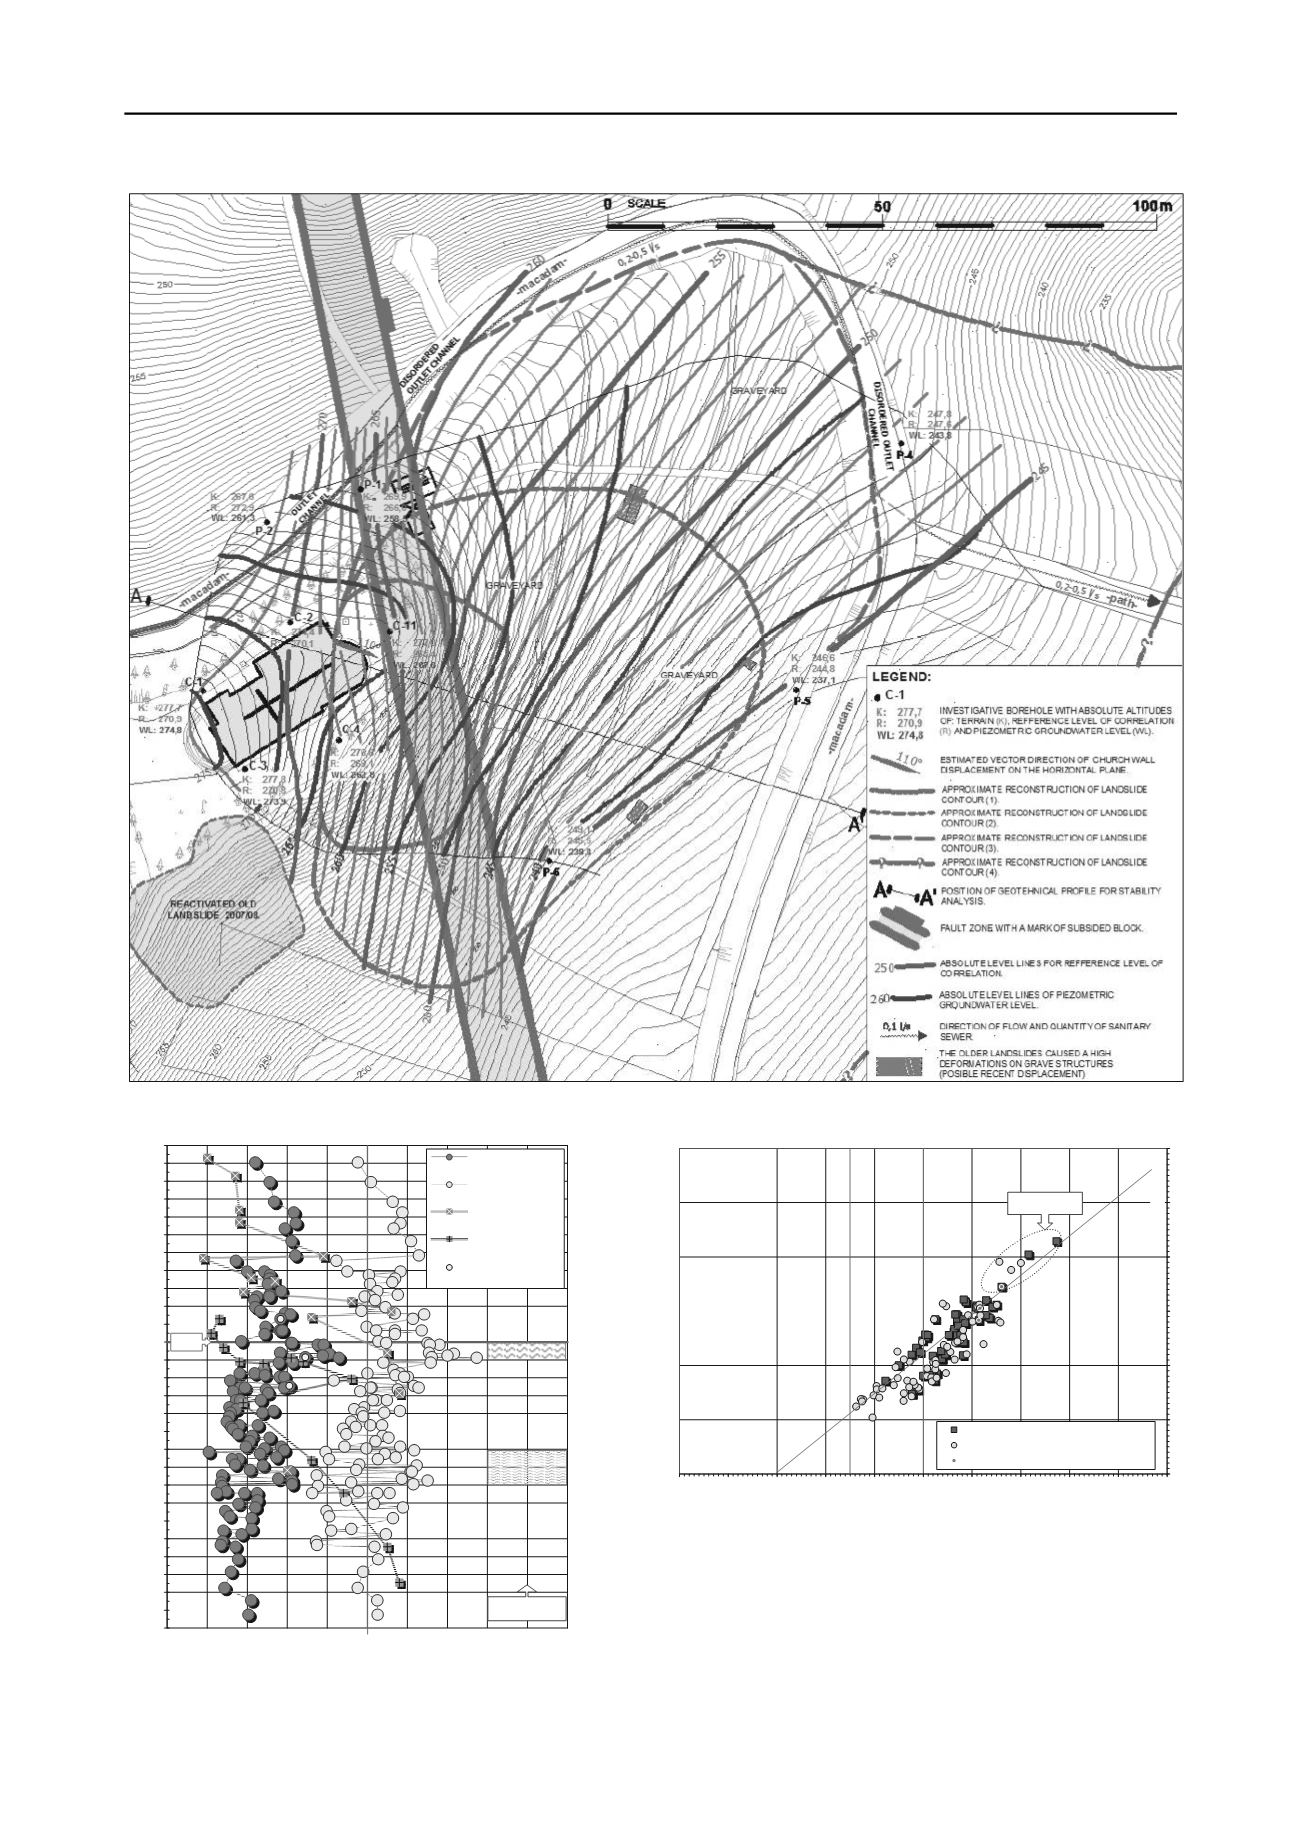
Figure 4. Detailed engineering geology map of the investigated area
-16
-15
-14
-13
-12
-11
-10
-9
-8
-7
-6
-5
-4
-3
-2
-1
0
1
2
3
4
5
6
7
8
9
10
11
0
10
20
30
40
50
60
70
80
90
100
PI (ALLBOREHOLES)
WL (ALLBOREHOLES)
SPT (BOREHOLES NEAR
THECHURCH)
SPT (BOREHOLES AT
THEGRAVEYARD)
PI: SAMPLESFORRING
SHEARTEST
LIQUID LIMIT -
LL
& PLASTICITY INDEX -
PI (%)
;
SPT
(NUMBER OF BLOWS - TUBE)
RNK
SAMPLE OR SPT POSITION WITH RESPECT TO REFFERENCE LEVEL OF CORRELATION
(RNK
±
m)
1
2
3
5
4
GEOTECHNICAL
ZONE
0
10
20
30
40
50
60
0
10
20
30
40
50
60
70
80
90
1
PLASTICITY INDEX -PI (%)
Figure 5. Geotechnical correlation column of the landslide.
Figure 6. Plasticity chart of materials from the landslide. The encircled
zone contains samples from preferred slip-zone
The unexpected “swaying” of eastern part of church was
recorded (i.e. the movements of whole church block had
alterative directions). This has been confirmed by independent
records in horizontal and vertical tilt meters on neighbouring
east and south wall, also accompanied with relative closing or
opening of cracks.
The ground water levels were not measured in the same
frequency, but the collected data indicate possible correlation of
seasonal variations of water levels with the directions of wall
movements.
00
LIQUID LIMIT -LL (%)
SAMPLESFROMBOREHOLESNEARTHECHURCH
SAMPLESFROMBOREHOLESATTHEGRAVEYARD
SAMPLEFORRINGSHEAR
CL
ML
CI
OL
MI OI
CH
MH OH
SF
SC
GEOTECHNICAL
ZONE - 2


