560
Proceedings of the 18
th
International Conference on Soil Mechanics and Geotechnical Engineering, Paris 2013
distributed in practice. The concept of
“
mass permeability
”
is
proposed to evaluate the permeability not of each element but of
the whole layer in one body. It is regarded as the macroscopic
capability of permeability for the individual sand gravel layers
by considering the horizontal continuity, the change in thickness
and the degree of fine contents of them. Mimura and Jeon
(2011) evaluated the mass permeability of the Pleistocene sand
gravel layers using the simple foundation model as shown in
Fig.2. The distribution of sand gravel layers not only in the
loading area but also in the area that can rule out the effect of
the hydraulic boundary condition should be considered to assess
the mechanism of the propagation/dissipation of excess pore
water pressure in the coupled stress-flow analysis. In the sense,
on the basis of the assumption that the hydraulic gradient
derived in the representative foundation model having the
horizontally even layer with constant thickness is regarded as
the standard one for the individual Pleistocene sand gravel
layers, the evaluated mass permeability can be the
representative of the capacity of permeability for the individual
Pleistocene sand gravel layers at KIX. The standard hydraulic
gradient is hence applied to the geologically genuine foundation
model that has been developed to consider the actual stress level
not only of the monitoring point but also of the considered area
for the numerical analysis. Due attention should be paid to the
fact that this assumption is only considered in horizontal
position for the individual Pleistocene sand gravel layers.
3 FOUNDATION MODEL AND HYDRAULIC
BOUNDARY
The differential settlement of the individual Pleistocene clay
layers as well as the excess pore water pressure at various
depths, both in the clay and the sand gravel layers, have been
measured at a lot of points of KIX. Figure 1 shows the plan
view of KIX together with the location of representative
monitoring points on the 1
st
phase island. A series of elaso-
viscoplastic finite element analyses is carried out along the
representative section shown by A-A
’
at monitoring point 1 in
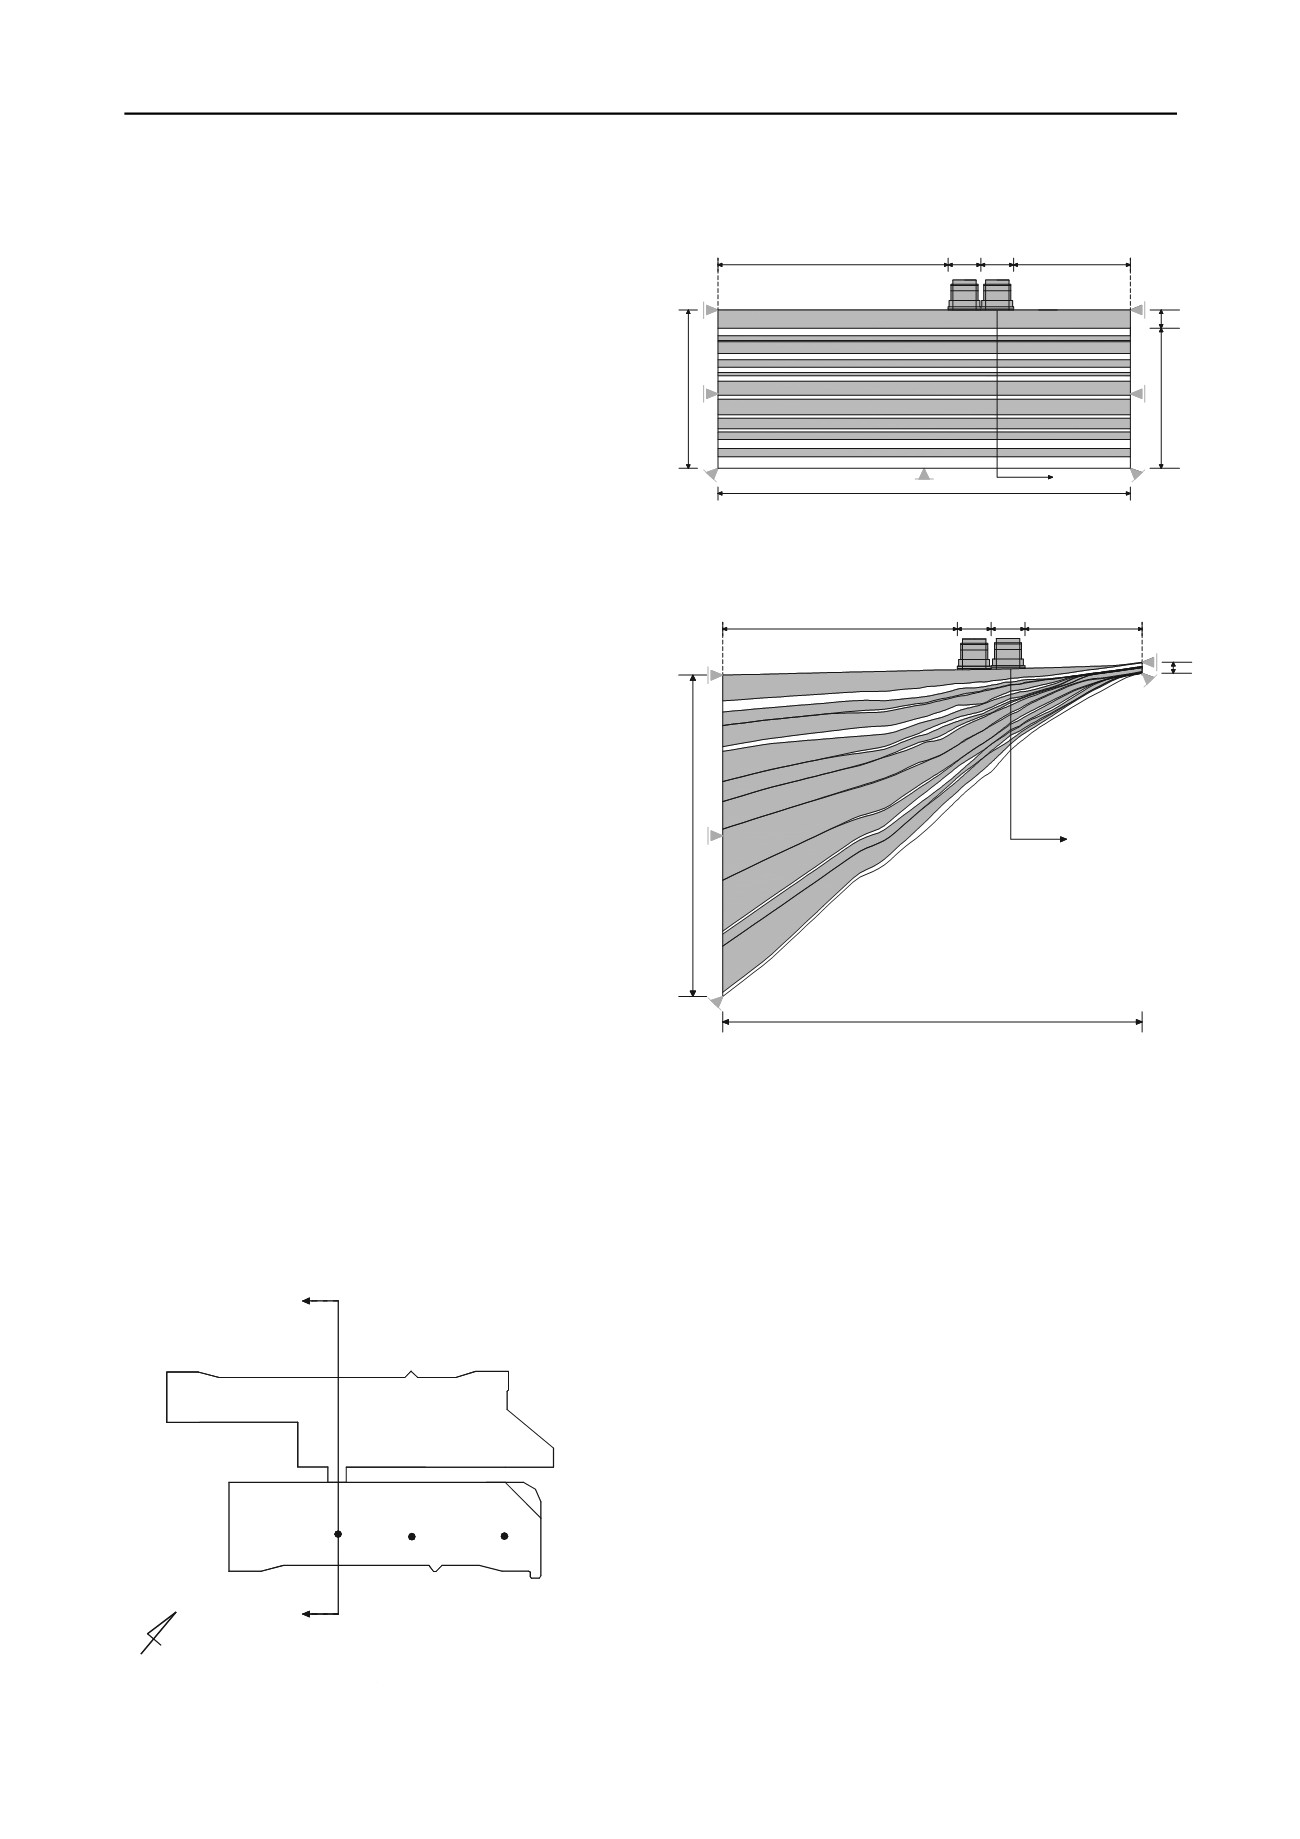
Fig.1. Figure.2 shows the representative foundation model
assumed to be horizontally even layer that have a constant
thickness and continuous layer based on the boring data at the
monitoring point 1. Figure.3 shows the geologically genuine
foundation model having the inclined base and layers that is
constructed based on the soil exploration and geological survey
data (Kitada et al, 2011). The clay layers increase in thickness
towards the offing and the sand gravel layers drastically change
in thickness horizontally. The continuity of the individual layers
is still guaranteed even for the geologically genuine foundation
model in the present study. Here, Ma and Ds denote marine clay
and Pleistocene sand gravel layer respectively. Ma13 is the
Holocene marine clay whereas others are the Pleistocene origin.
For the Holocene clay deposit, Ma13, sand drains are driven in
a rectangular configuration with a pitch of 2.0 to 2.5 meters to
promote consolidation. The lateral boundary of the clay layers is
assumed to be undrained while the one of the sand gravel layers
is assumed to be fully drained. Mimura and Jang (2005b)
reported that when the distance to the boundary is set to be
about 10 times of the loading area, the effect of the hydraulic
boundary condition can be ruled out. Based on the findings, the
same condition is satisfied even for the foundation models used
in the present study. The distance to the offshore and onshore
boundary is set to be 10,000m and 5,000m respectively. The
present two foundation models are divided into finite element
mesh consisting of 8,580 nodal points and 8,378 elements.
4 LOADING CONDITION AND SOIL PARAMETERS
The prescribed final overburden due to airport fill construction
amounts to about 430kPa at the 1
st
phase island and about
530kPa at the 2
nd
phase island respectively. The 2
nd
reclamation
is started after about 13years from the 1
st
reclamation. In the
present analysis, the permeable capability evaluated from the
concept of
“
mass permeability
”
for the Pleistocene sand gravel
layers is applied for the present finite element analysis. On the
basis of the findings by Itoh et al. (2001), the relatively high
permeable capability are assumed for Ds1,3 10 because they
have been evaluated as gravelly, horizontally continuous and
Monitoring point 1
N
S
2 phase island
1 phase island
st
nd
S2
S3
(S1)
A (Onshore side)
A' (Offshore side)
(Representative section)
Figure 1. Plan view of Kansai International Airport and the location of
monitoring points on the 1
st
phase island
(Onshore side)
(Offshore side)
1 phase island
st
2 phase island
nd
17,880m
10,000m
1440m 5,000m
Ma13
Ds1
Dtc
Ma12
Ds2
Ds3
Ma11U
Ma11L
Ds4
Ds5
Ds6
Ds7
Ds8
Ds9
Ds10
Ma10
Ma9
Doc5&Ma8
Ma7
Ma6
148.0m
Monitoring point 1
131.0m 17.0m
A'
A
1440m
Fi
gure 2. Representative foundation model of KIX for finite element analysis
at representative section
10,000m
1440m 5,000m
A'
A
1 phase island
Monitoring point 1
588.7m
20.2m
17,880m
Ma13
Ds1
Dtc
Ma12
Ds2
Ds3
Ma11U
Ma11L
Ds4
Ds5 Ds6
Ds7
Ds8
Ds9
Ds10
Ma10
Ma9
Doc5&Ma8
Ma7
Ma6
st
2 phase island
nd
1440m
(Onshore side)
(Offshore side)
Figure 3. Geologically genuine foundation model of KIX for finite
element analysis at representative section


