565
Technical Committee 102 /
Comité technique 102
0
10
20
30
40
50
60
70
80
90
100
0.001
0.01
0.1
1
10
Percent Passing
Particle Size (mm)
Poorly
Graded Sand
Sandy Clay
Silty Sand
Table 2. Properties of the Test Soil
4 TEST DATA INTERPRETATION
Figure 3 shows the results from the testing using four
different run times. Based on the results from previous
testing in a sand pit, Gabr et al. (2012) evaluated a critical
stream power (P
c
) value = 24 Watts/m
2
for a sand with D
50
=
0.30 mm. Using a similar technique of extrapolation
approach, the data in Figure 3 is extrapolated to zero
penetration rate to yield an average P
c
value of 16 Watts/m
2
for the test soil. Similar to the observation by Gabr et al.
(2012), a minimum of “45 sec” run time is needed to provide
a reliable measurement of the penetration rate. To calculate
critical shear velocity from the P
c
, the following equation is
used (Annandale, 2006):
qh P
c
(2)
where, γ is unit weight of water, q is the discharge per unit
area, and h is the hydraulic head including the jet velocity
head.
0
0.5
1
1.5
2
2.5
3
3.5
10
100
Penetration rate (cm/s)
Stream Power (Watts/m
2
)
Run time = 15s
Run time = 30s
Run time = 45s
Run time = 60s
Figure 3. Extrapolation of the Stream Power to Assess
Critical Stream Power Value (P
c
)
Using Equation 2, a critical velocity is back calculated as
0.32 m/s corresponding to a critical stream power value of 16
Watts/m
2
. As flow field changes around the pier, and
therefore the flow-related shear stress, the shear stress below
which no scour is assumed to take place is estimated using
the equation proposed by Briaud et al. (1999):
)
10
1
log
1 (
094 .0
2
max
e
R
V
where, ρ is water density, R
e
= VD/υ is Reynolds number, V
is depth average flow velocity at the location of the pier if the
bridge were not there, D is pier diameter and υ is kinematic
viscosity of water. In this case, assuming a pier diameter of 1
m and a depth of flow= 2 m, the critical shear stress value is
estimated equal to 1.75 Pa.
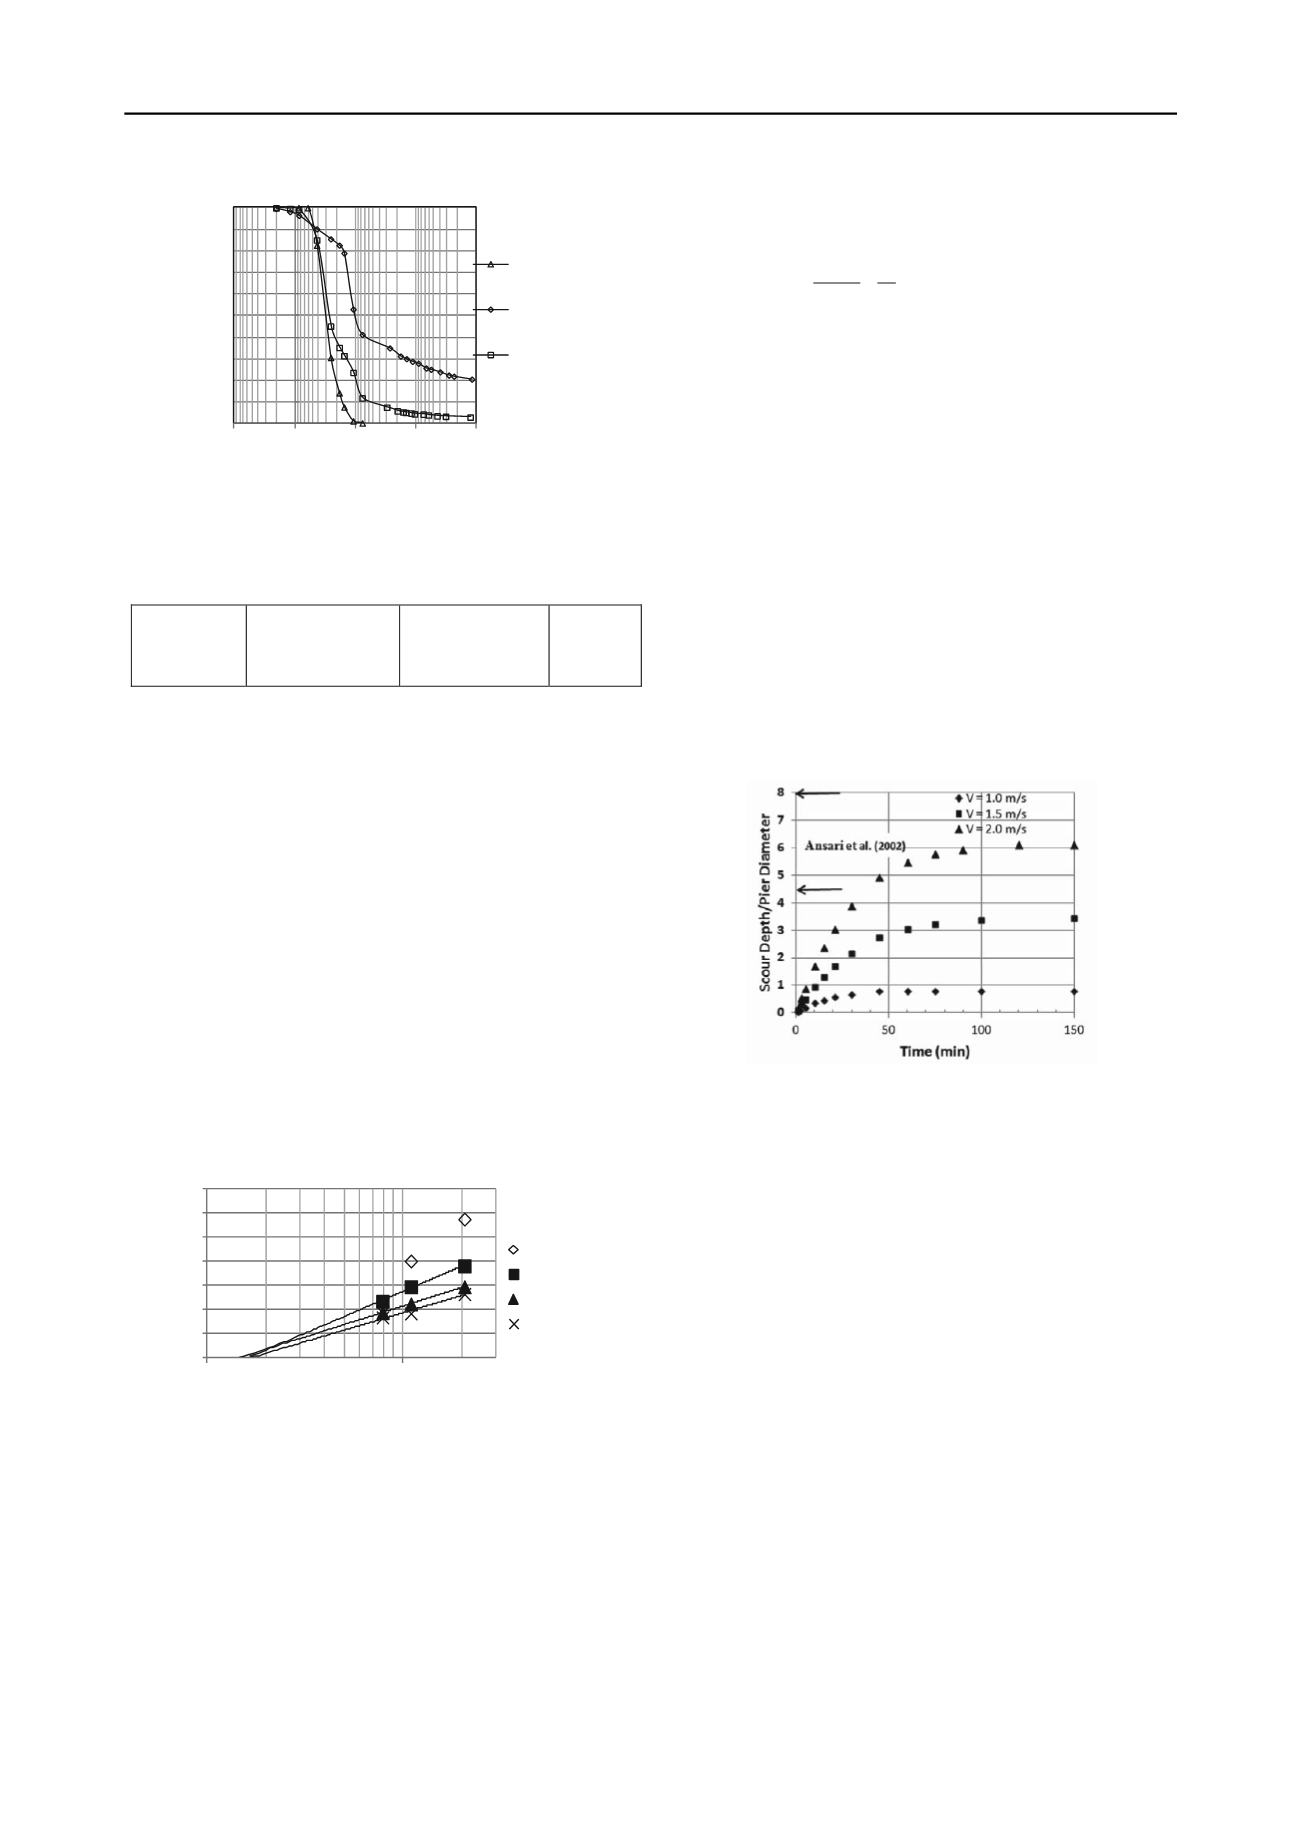
Figure 4 shows the equivalent penetration rate per shear
stress function for the averaged test data. During testing, the
probe tip is in close proximity of the soil mass, and erosion
occurs within the jet potential core. The applied shear stress
in this case is estimated using the relationship presented by
Annandale (2006) as:
2
UC
f
(4)
where:
= applied shear stress to bed in N/m
2
, U = average
velocity of water at the tip (m/s),
= density (kg/m
3
), and C
f
is a friction coefficient = 0.016 according to Annandale
(2006).
Figure 4. Computed Scour Around Circular Bridge Pier on Silty
Sand Bed; Range between Arrows is Values Estimated using
Empirical Equation
.
The slope of the data for the 45 and 60 secs in Figure 3
provides a parameter equivalent to the detachment rate
coefficient (k
d
) proposed by Mehta (1991). The k
d
values of
0.017 cm/sec per N/m
2
and 0.015 cm/sec per N/m
2
are
estimated, respectively, for the test soil at run times of 45 and
60 seconds. In comparison, k
d
values of 0.017 cm/sec per
N/m
2
and 0.013 cm/sec per N/m
2
were observed respectively
for sand at run times of 45 and 60 seconds by Gabr et al
(2012). The K
d
value obtained at 60 sec for the test soil is
approximately 13% higher than the value obtained for sand.
This observation agrees with the conclusion made by Ansari
et al. (2002), where the authors indicated that in a lower fines
content (<20%) type of soil, non-plastic fine particles are
carried away as the resistance due to “cohesion” becomes
insignificant.
5 SCOUR AROUND BRIDGE PIERS
Local scour around bridge piers occurs due to induced shear
stresses associated with flow field changes. Ettema et al.
Dry unit
weight
(kN/m
3
) =
17.7
Mean Particle
Diameter, D
50
(mm) = 0.26
Undrained Shear
Strength, C
u
(kPa)
=5-8
PI=
Non-
Plastic
Figure 2. Grain Size Distribution of Test Soil: Silty
Sand


