573
Technical Committee 102 /
Comité technique 102
3 MULTI-SCALE SEDIMENT MONITORING AND
EVALUTION METHOD TO REMEDIATION
EFFECTIVENESS
Multi-scale sediment monitoring techniques is used in
Tsengwen reservoir watershed to study remediation
effectiveness and topographical changes. This section describes
the method about how to systematically study and analyze soil
erosion, landslide areas, and sediment trapping in the check
dams from easily measured physical quantities such as depth,
area, and volume by collecting time-dependent monitoring data
and multi-stage remote sensing information in a watershed
scale. A case study of the Longjiao subwatershed was chosen to
be validated with remediation effort. The above proposed
methods are detailed separately below.
3.1 Depth-based evaluation method
Soil erosion estimates were often based on empirical equations,
such as USLE, MUSLE, and RUSLE, etc. These empirical
equations are limited regionally and by spatial distribution of
rainfalls. Therefore, this study focused on the different
vegetated slopes to design erosion pins by some research reports
(Schumn, 1956). Site surveys were conducted to measure
surface erosion depth to investigate the state of slope soil after
erosion from rainfalls. The result was used to assess the
inhibition rate of soil erosion from both remediated and non-
remediated hillslopes in order to understand the efficiency of
remediation. To quantify the soil erosion suppression ratio (
SSR
)
from the measured soil erosion depth of several erosion pins
(see Figure 5) embedded in remediated and non-remediated
hillslopes, we used an index value to depict efficiency of soil
erosion retention after completing remediation. Higher index
values indicate higher soil erosion suppression. Therefore, this
study uses this index (
SSR
) to understand the remediation
effectiveness of the hillslopes.
SSR
is defined as follows
%100
(%)
DR
DN
DR
E
E E
SSR
(1)
Where
SSR
is soil erosion suppression ratio (%)
;
E
DR
is surface
eroded soil depth of remediated hillslope (mm)
;
E
DN
is surface
eroded soil depth of non-remediated hillslope (mm).
Figure 5. Schematic layout and photos of erosion pins embedded in
remediated/non-remediated hillslope.
3.2 Area-based evaluation method
To understand the evolution of vegetation coverage of the
Tsengwen reservoir watershed resulting from remediation
efforts, multi-spectral high-resolution satellite images from
different periods are adopted to analyze the ratio of green cover
to assess the vegetation restoration after remediation.
Normalized Difference Vegetation Index (NDVI) is currently a
popular method to assess vegetation coverage (Kriegler
et al.
,
1969). The
NDVI
is calculated from these individual
measurements as follows:
VIS
NIR
VIS
NIR
NDVI
(2)
where
VIS
and
NIR
stand for the spectral reflectance
measurements acquired in the visible (red) and near-infrared
regions, respectively. The
NDVI
value is normalized between -
1.0 to 1.0. Values of NDVI above a certain threshold
correspond to vegetation coverage area and values below the
threshold correspond to non-vegetation coverage areas, as
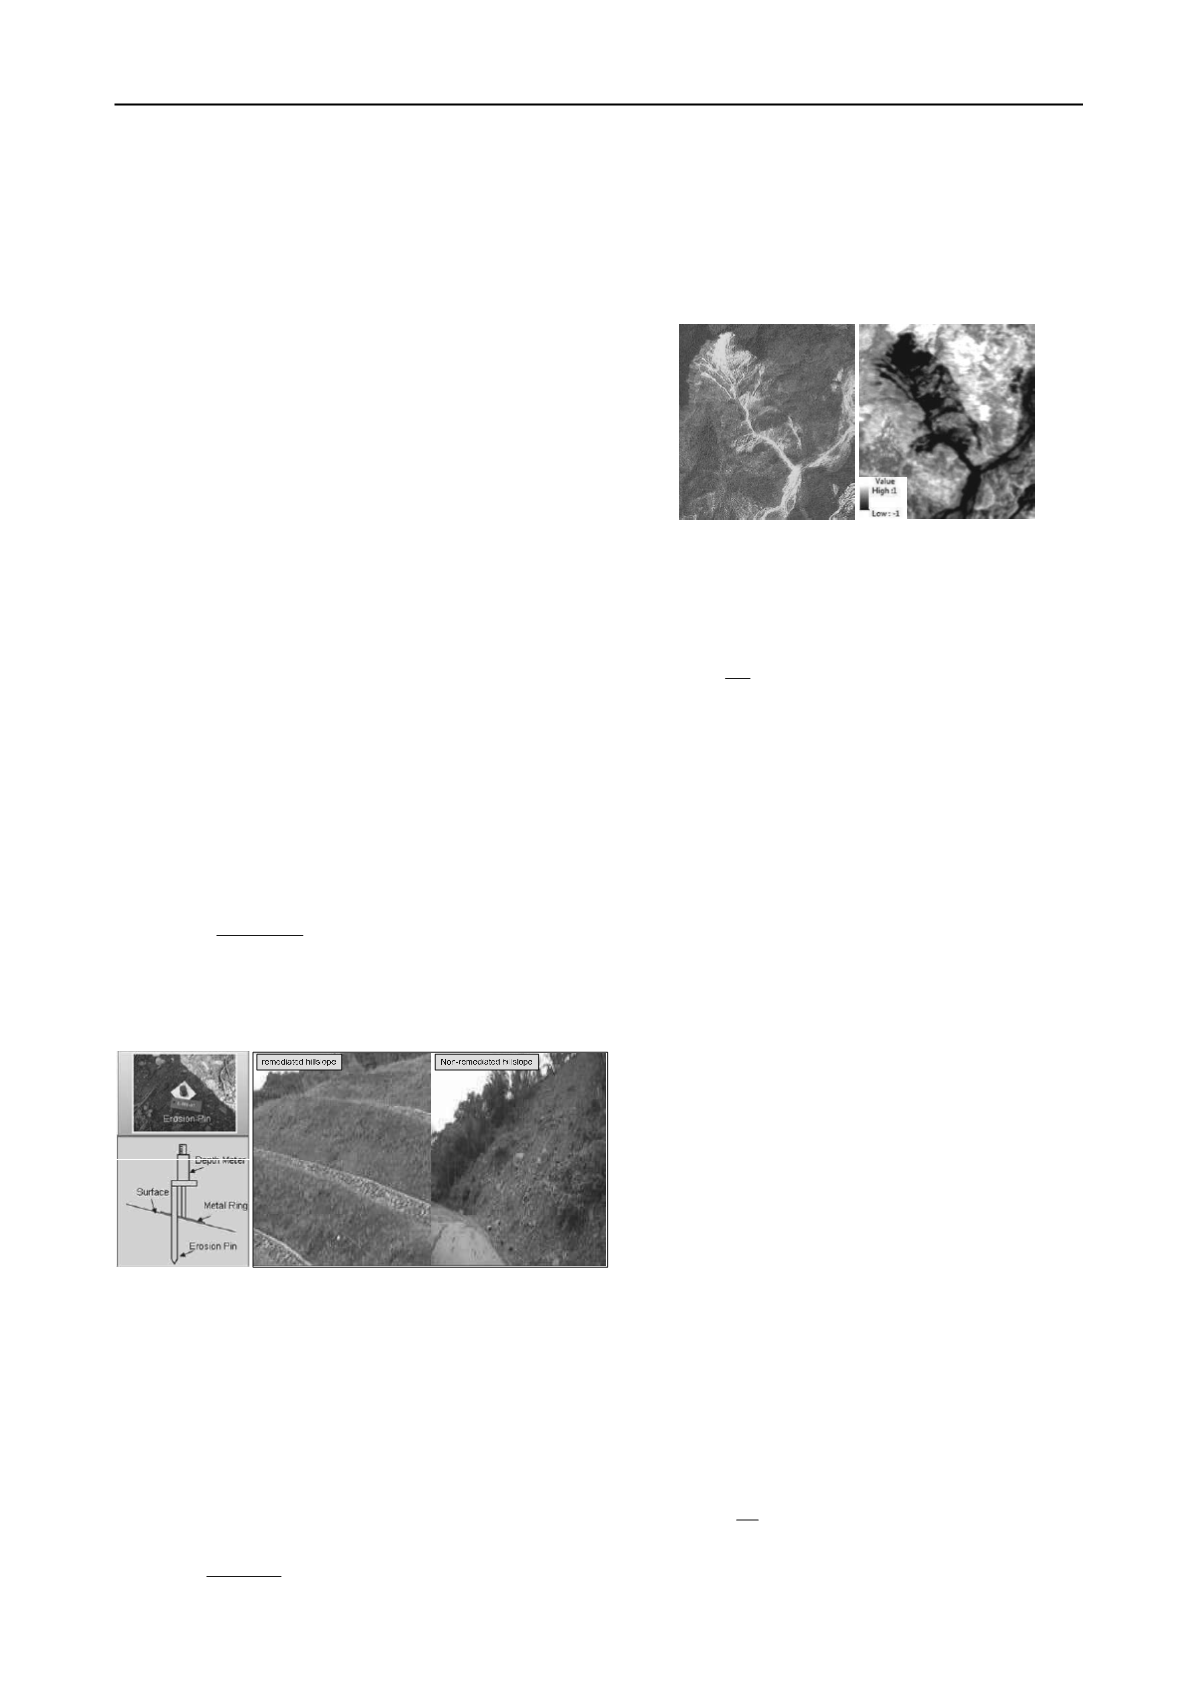
shown in Figure 6.
Figure 6. Orginal
satellite image and the classified image
from
results of
NDVI
.
Once the NDVI has been used to classify the images into
vegetated and non-vegetated zones, the ratio of vegetation
coverage (
VR)
involved with the total area is estimated, as
shown in Eq. (3).
%100
(%)
C
V
A
A
VR
(3)
Where
A
c
is a given watershed area, and
A
v
is vegetated area
within a given watershed.
3.3 Volume-based evaluation method
This study compiled satellite images to identify the landslide
distribution. Number of landslides, existing landslide area,
incremental landslide area, and spatial distribution in key
regions were obtained through digital interpretation to
understand its evolution. Further, this was complemented with
multi-period terrain data, established by airborne LiDAR, to
quickly obtain information on terrain changes in each sub-
catchment area and assess the effectiveness of the remediation
projects. To evaluate the effectiveness of check dams, this study
utilized airborne LiDAR (Light Detection And Ranging)
technology to survey and produce high resolution DEMs of the
Tsengwen reservoir watershed. The pre-event DTM is
subtracted from the post-event DTM. A negative value in the
grid represents failure or erosion, and positive value indicates
deposits. Variation in volume of a grid can be obtained by
multiplying this value by the area of the unit grid (see Figure. 7).
The total volume of landside material and sediment trapped by
the check dam can also be obtained from multiple LiDAR
generated DTMs. Then, sediment discharge and trapping
efficiency of dams can be precisely calculated. It can also be
applied to monitor the accumulated volume of sediment on the
confluence between tributaries and river, growth of alluvial fan,
and large scale wedge like slope failures. Comparison of
LiDAR DEMs from different periods can also indicate terrain
migration and be used to trace sediment transport from
tributaries, especially in extreme typhoon disasters. Sediment
trapping ratio (STR) can be assessed by measuring the volume
of deposited sediment in front of the check dams (Sophie
et al
.,
2008). If
STR
after remediation is higher than before
remediation, it means that check dams are effectively
controlling sediment transport and have adequate remediation
efficiency levels. The sediment trapping ratio can be expressed
as
:
%100
(%)
y
d
V
V
STR
(4)
Where
V
d
is the trapped volume in the check dam(m
3
)
;
V
y
is
the sediment yield from upstream (m
3
).


