577
        
        
          Technical Committee 102 /


            Comité technique 102


          0
        
        
          4
        
        
          8
        
        
          12
        
        
          16
        
        
          20
        
        
          24
        
        
          2
        
        
          0
        
        
          4
        
        
          8
        
        
          12
        
        
          16
        
        
          20
        
        
          24
        
        
          28
        
        
          8
        
        
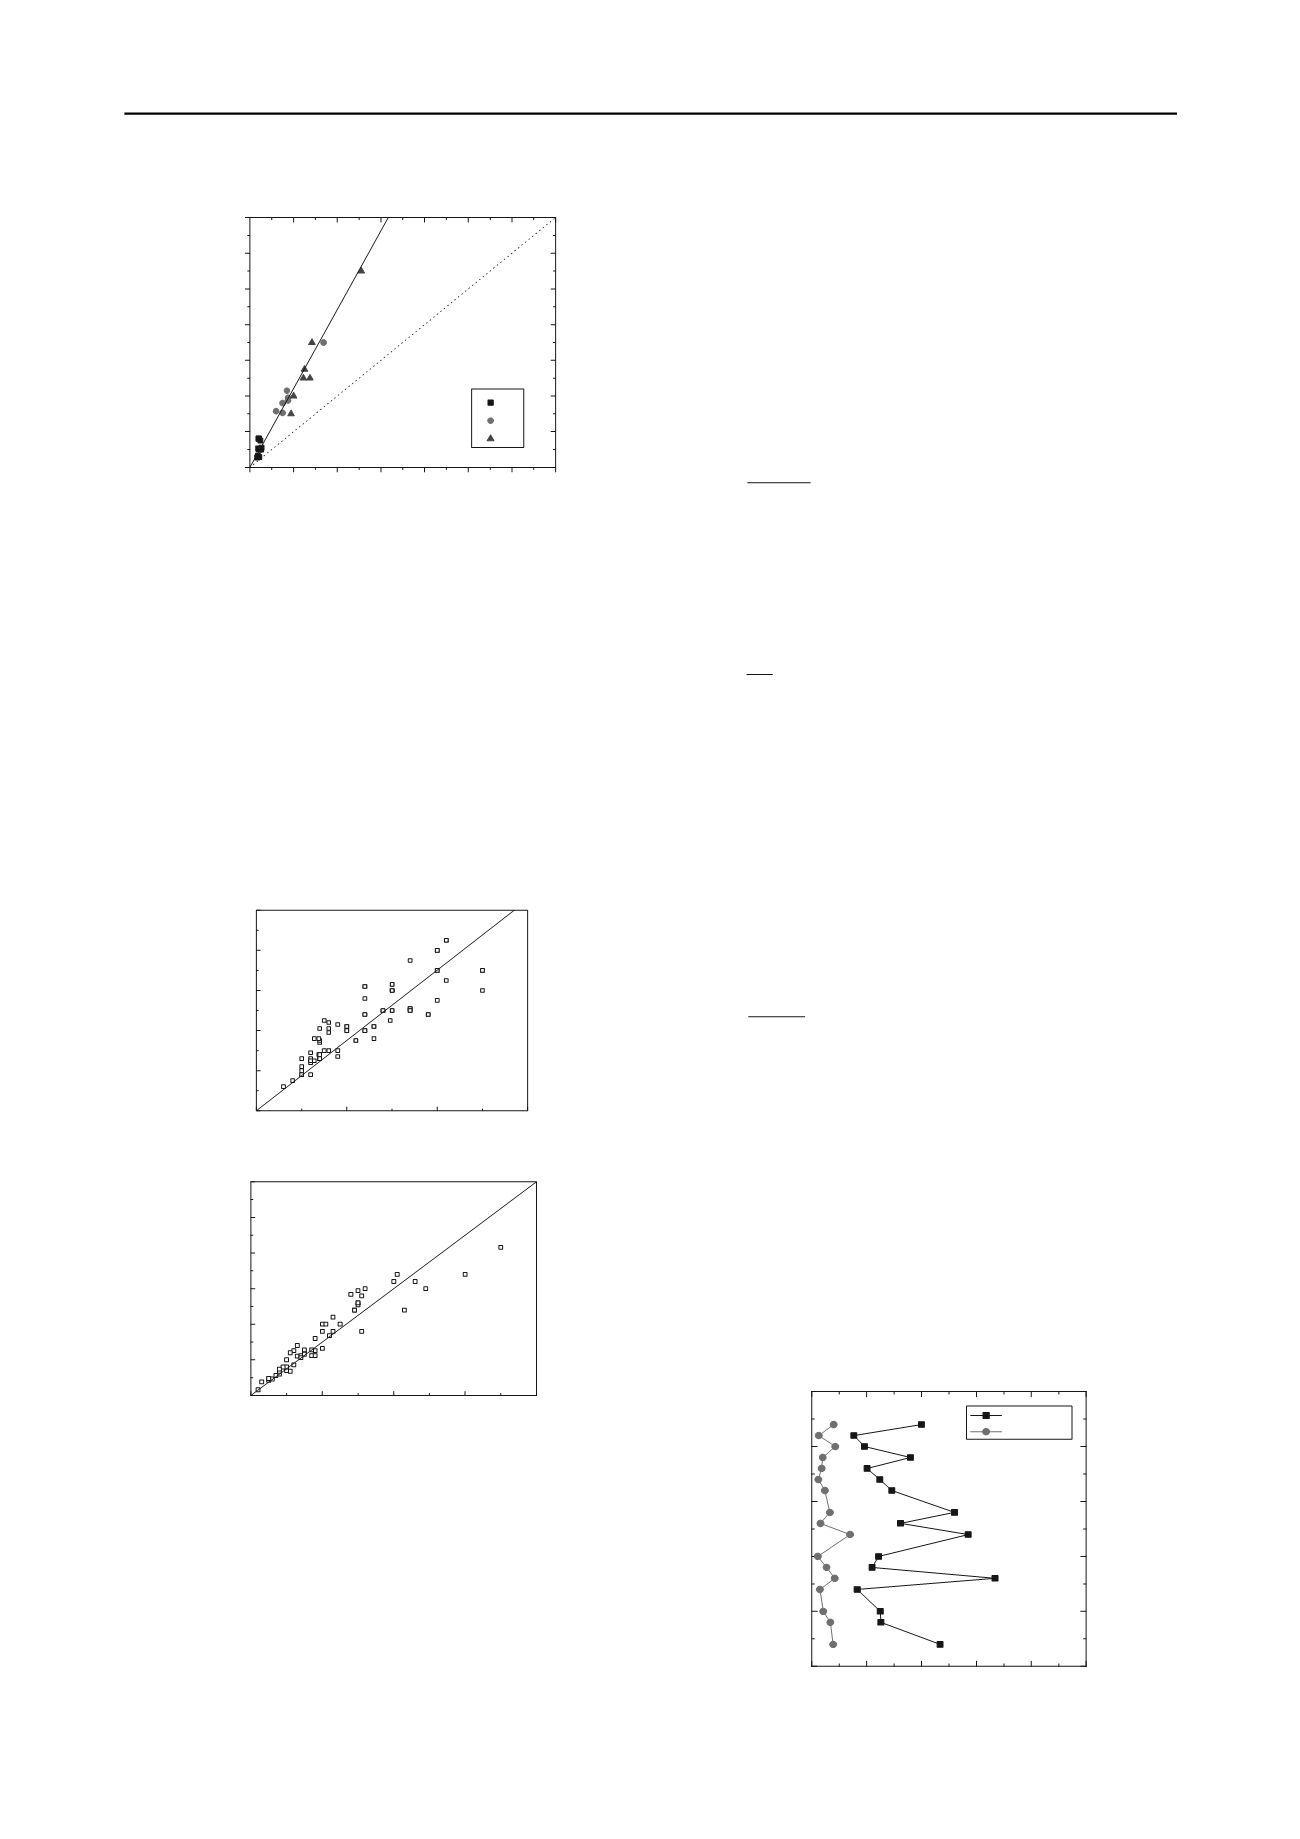
          Kulhawy and Mayne(1990)
        
        
          M
        
        
          -CPTU
        
        
          =2.21M
        
        
          -Lab
        
        
          R
        
        
          2
        
        
          =0. 98
        
        
          M -CPTU /MPa
        
        
          M
        
        
          - l ab
        
        
          /MPa
        
        
          CH
        
        
          CL
        
        
          ML
        
        
          Figure 3. Measured versus predicted constrained modulus values
        
        
          To examine the possibility for better correlations to estimate
        
        
          the constrained modulus from CPTu data, the corrected cone tip
        
        
          resistance (


            q


          t
        
        
          ) and the net cone resistance (


            q


          t
        
        
          -


            σ


          vo
        
        
          ) were plotted
        
        
          against the laboratory measured constrained modulus as shown
        
        
          in Figures 4(


            a


          ) and 4(


            b


          ). A linear correlation was obtained
        
        
          between M and qt as follows:


            M


          =3.36


            q


          t


            R


            2


          =0.78                                 (4)
        
        
          And the following linear correlation was also obtained
        
        
          between M and (


            q


          t
        
        
          -


            σ


          v0
        
        
          ) given as follows:


            M


          =3.73(


            q


          t
        
        
          -


            σ


          v0
        
        
          )


            R


            2


          =0.92                                  (5)
        
        
          The arithmetic mean and standard deviation of (M
        
        
          -CPTU
        
        
          /M
        
        
          -
        
        
          lab
        
        
          ) are 0.85 and 0.23 for the first correlation (


            M


          = 3.36


            q


            t


          ),
        
        
          whereas 1.02 and 0.29 for the second correlation [


            M


          =3.73(


            q


            t


          -


            σ


            vo


          )].
        
        
          0
        
        
          1
        
        
          2
        
        
          3
        
        
          0
        
        
          2
        
        
          4
        
        
          6
        
        
          8
        
        
          10
        
        
          Measur ed M/ MPa
        
        
          q
        
        
          t
        
        
          / MPa
        
        
          M=3. 36q
        
        
          t
        
        
          R
        
        
          2
        
        
          =0. 78
        
        
          (


            a


          )
        
        
          0
        
        
          2
        
        
          4
        
        
          6
        
        
          8
        
        
          0
        
        
          5
        
        
          10
        
        
          15
        
        
          20
        
        
          25
        
        
          30
        
        
          Measur ed M/ MPa
        
        
          ( q
        
        
          t
        
        
          -


          v0
        
        
          ) / MPa
        
        
          M=3. 73( q
        
        
          t
        
        
          -


          v0
        
        
          )
        
        
          R
        
        
          2
        
        
          =0. 92
        
        
          (


            b


          )
        
        
          Figure 4.  (


            a


          )


            q


          t
        
        
          ~Measured M ; (


            b


          ) (


            q


          t
        
        
          -


            σ


          v0
        
        
          ) ~Measured M


            3.3 Consolidation and permeability properties


          Many theoretical and semi-empirical methods have been
        
        
          proposed for deriving the coefficient of consolidation from
        
        
          CPTu dissipation data. Teh and Houlsby (1991) proposed a
        
        
          relationship between a dimensionless time factor and


            c


            h


          value
        
        
          based on numerical analysis of dissipation pore pressure with
        
        
          the consideration of soil rigidity index parameter. Robertson et
        
        
          al. (1992)
        
        
          reviewed some dissipation data from piezocone tests,
        
        
          and concluded that the predicted coefficient of consolidation by
        
        
          Teh and Houlsby (1991) solution compared well with reference
        
        
          values from laboratory tests and field observations. Schnaid et
        
        
          al. (1996) and Danziger et al. (1997) showed that, when Teh and
        
        
          Houlsby’s approach was employed to interpret various CPTU
        
        
          results, the calculated values of


            c


            h


          were of the same order of
        
        
          magnitude as those measured independently in oedometer tests
        
        
          in the laboratory. Abu-Farsakh and Nazzal (2005) compared
        
        
          seven CPTU methods and showed that Teh and Houlsby (1991)
        
        
          and Teh (1987) methods can estimate


            c


            h


          value better than the
        
        
          other prediction methods.
        
        
          Teh and Houlsby (1991) proposed a relationship between a
        
        
          dimensionless time factor and


            c


            h


          value. The dimensionless time
        
        
          factor,


            T


          *
        
        
          ,
        
        
          is defined as:


          5.0
        
        
          2
        
        
          *


            r


            h


            I r


            tc


            T


          (6)
        
        
          where


            c


            h


          = coefficient of consolidation in horizontal
        
        
          direction;


            r


          = radius of cone, typically 17.85 mm;


            I


            r


          = rigidity
        
        
          index,


            G/S


            u


          . Among the methods available for evaluating


            c


            h


          from piezocone dissipation tests, the one proposed by Teh and
        
        
          Houlsby (1991) is probably most widely used (Robertson et al.
        
        
          1992). Teh and Houlsby’s (1991) equation is as follows:
        
        
          2
        
        
          50
        
        
          50


            r


            t


            T c


            h


          (7)
        
        
          where the time factor


            T


          50
        
        
          is related to the location of the
        
        
          filter element and cone size. For a cone with a cross-sectional
        
        
          area of 10 cm
        
        
          2
        
        
          and with a shoulder filter element,


            T


          50
        
        
          = 0.245
        
        
          (Teh and Houlsby 1991). The


            t


          50
        
        
          is the measured time for 50%
        
        
          dissipation. The method proposed by Teh and Houlsby (1991)
        
        
          was used here to interpret the coefficient of consolidation for
        
        
          the pore pressure dissipation curves in this study.
        
        
          The coefficient of permeability in the horizontal direction
        
        
          can be estimated from a CPTU dissipation test and by means of
        
        
          the correlation factor (


            k


            h


          /


            k


            v


          ) proposed by Jamiolkowski et al.
        
        
          (1985). Baligh and Levadoux (1980) recommended that the
        
        
          horizontal coefficient of permeability could be estimated from
        
        
          the expression:


            h


            v


            w


            h


            RRc


            k


          '
        
        
          0
        
        
          3.2


          (8)
        
        
          where


            RR


          = compression ratio in the overconsolidated
        
        
          range, and can be obtained from the consolidation tests at the
        
        
          corresponding stress level.
        
        
          A comparison of the consolidation coefficient values
        
        
          measured by CPTu dissipation test and laboratory oedometer
        
        
          test is presented in Figure 5 in which the CPTU test measures


            c


          h
        
        
          values, whereas the conventional oedometer test measures


            c


          v
        
        
          . It
        
        
          can be seen that the


            c


          v
        
        
          values measured by oedometer test are
        
        
          lower than the


            c


          h
        
        
          values measured by CPTu tests. The


            c


          h
        
        
          values
        
        
          of the lacustrine clay measured by the CPTu tests are generally
        
        
          4-6 times larger than the


            c


          v
        
        
          values measured by the
        
        
          conventional
        
        
          oedometer
        
        
          test,
        
        
          indicating
        
        
          anisotropic
        
        
          characteristic of the soil.
        
        
          25
        
        
          20
        
        
          15
        
        
          10
        
        
          5
        
        
          0
        
        
          0
        
        
          1
        
        
          2
        
        
          3
        
        
          4
        
        
          5
        
        
          Depth (m)
        
        
          Coefficent of consolidation
        
        
          (
        
        
          10
        
        
          -3 cm 2
        
        
          /s
        
        
          )


            CPTU


            Oedometer


          Figure 5.  Comparison of cv and ch profiles measured from CPTu and
        
        
          laboratory tests