584
Proceedings of the 18
th
International Conference on Soil Mechanics and Geotechnical Engineering, Paris 2013
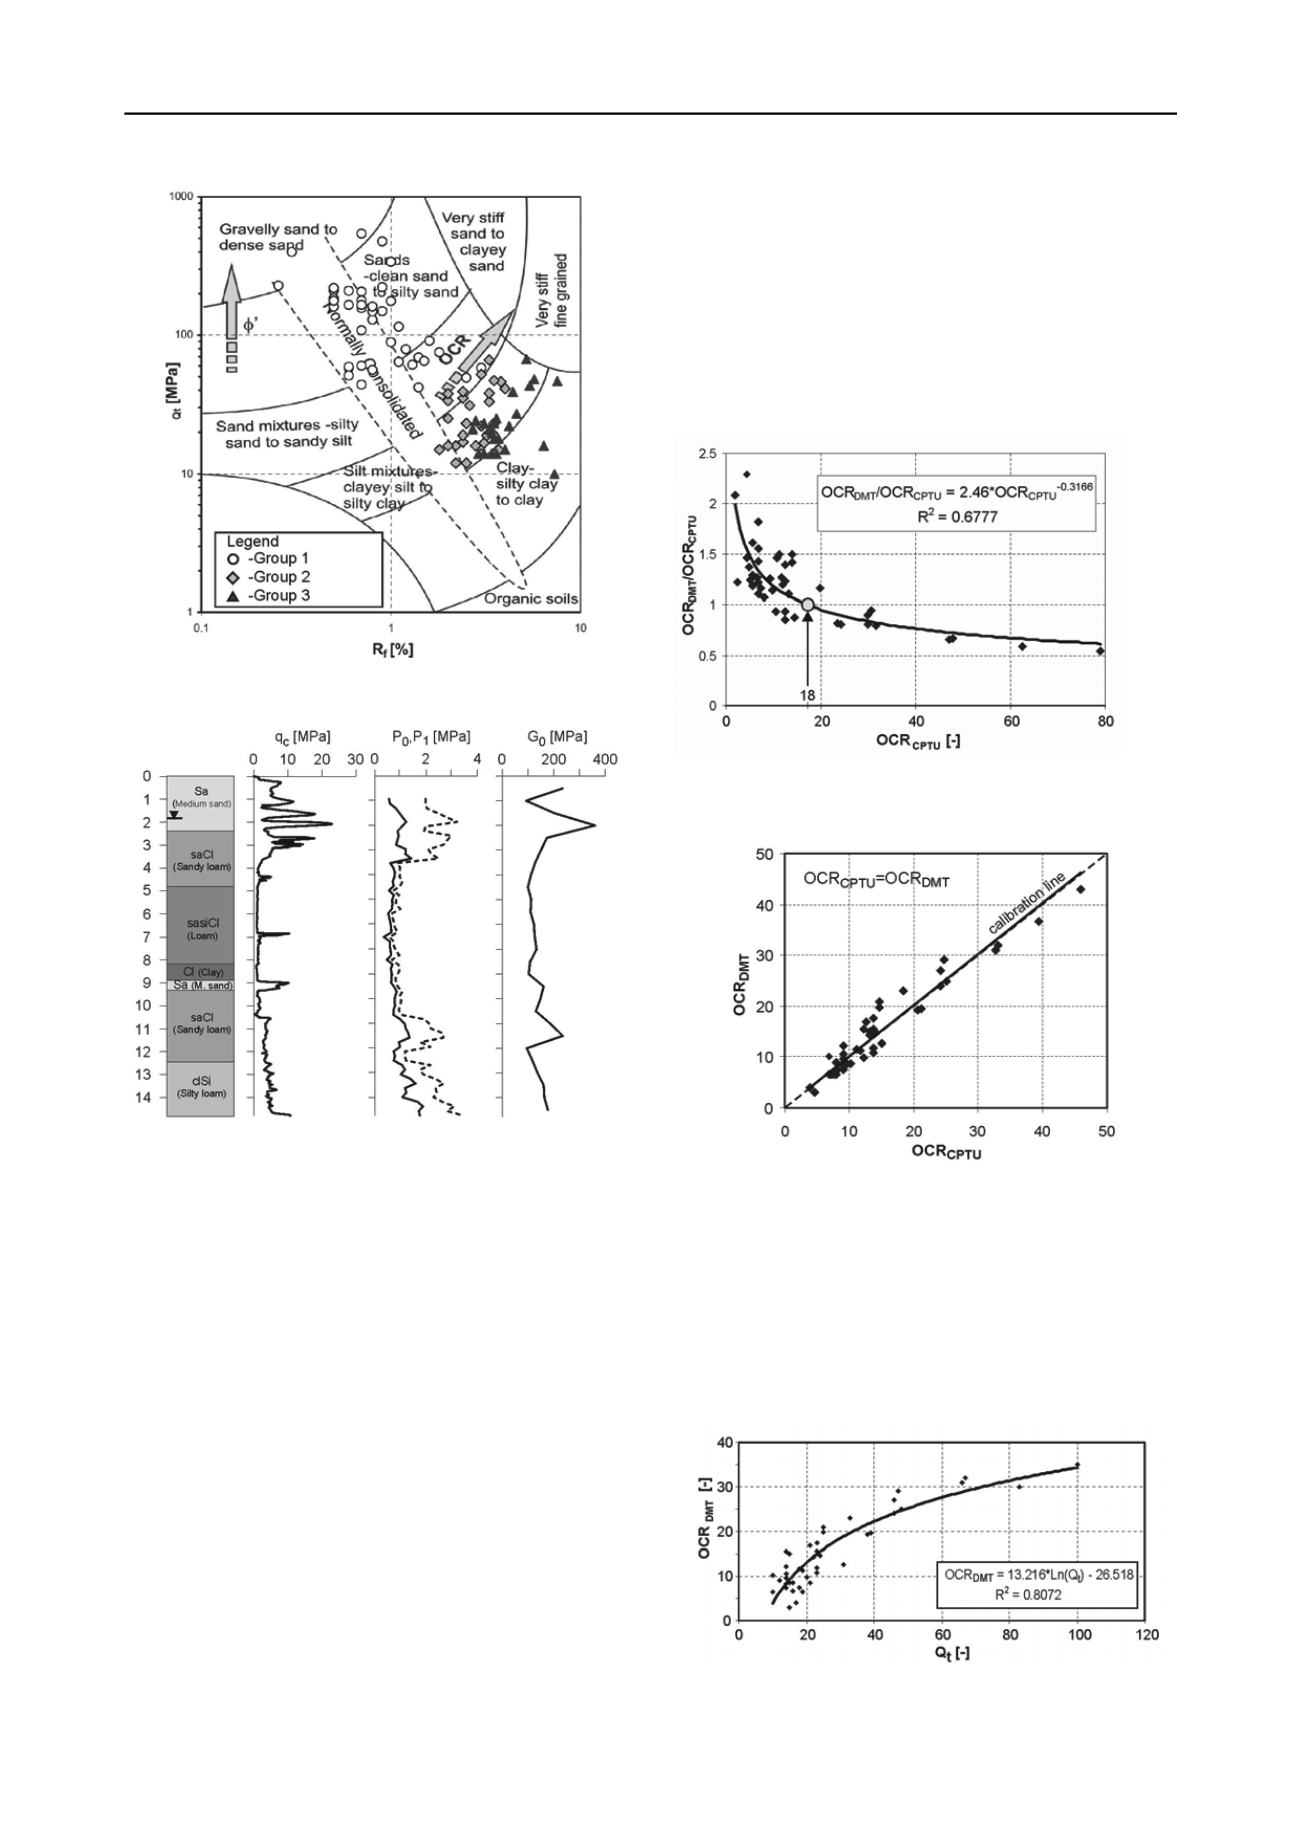
Figure 2. CPTU Soil classification chart (Lunne et al. 1997).
Figure 3. Geotechnical profile with CPTU and SDMT characteristics.
3
CONCEPT FOR THE IDENTIFICATION OF THE SOIL
PRECONSOLIDATION EFFECT IN SUBSOIL
Identification of the relationship between the genesis of subsoil
and a measure determining the overconsolidation rate, eg.
overconsolidation ratio OCR, is a complex problem. Of the two
discussed methods, CPTU and SDMT, the chance to determine
reliable OCR values is greater for SDMT, since the effect of
preconsolidation is strongly related with the geostatic stress
ho
.
For this reason in order to obtain a continuous picture of
changes in OCR of the subsoil in the examined locations
calibration was performed for OCR values determined using
cone resistance Q
t
, applying OCR values determined by SDMT.
In the approach three groups were identified for the discussed
locations: with complete drainage – sands (group I),
intermediate soils (group II) and clays (group III) (Fig. 2). The
groups of intermediate soils and clays were identified based on
the content of the clay fraction and the plasticity index I
p
.
The values of OCR from dilatometer testing for soils of
groups II and III were calculated from the relationship
(Marchetti (1999):
OCR = 0.5 (K
D
)
1,56
(1)
where: K
D
– horizontal stress index
The value of OCR for soils in CPTU testing was determined
using the nomogram proposed by Wierzbicki (2010), in which
OCR values are established on the basis of cone resistance Q
t
and the plasticity index of soil I
p
is considered. In the case of
non-cohesive soils OCR values were also assessed applying a
diagram proposed by Wierzbicki (2010). This diagram uses
both tests, i.e. CPTU and DMT, as it is constructed on the basis
of the formula proposed by Mayne (2000).
OCR = 5.04 K
0
1,54
(2)
Figure 4. Relaationship between coefficient OCR
DMT
/OCR
CPTU
and
coefficient OCR
CPTU
(group II and III).
Figure 5. Relationship between OCR
DMT
and OCR
CPTU
after calibration
(group II and III)
It results from Figs. 4 and 5 that the relationship between
OCR values from both tests has a high statistical evaluation.
This fact makes it possible to construct a direct dependence
between cone resistance Q
t
and OCR from SDMT (Fig. 6).
Values of OCR determined from this dependence were used to
supplement data for statistical analysis and next in the profiles
at different levels
v0
, where SDMT testing was not performed.
Figure 6. Relationship between cone resistance q
t
and OCR
DMT
coefficient.


