592
Proceedings of the 18
th
International Conference on Soil Mechanics and Geotechnical Engineering, Paris 2013
N
tanϕ √1 tan
ϕ
. exp2ξ tanϕ
sinϕ 1
cosϕ . exp2ξ tanϕ
N
N
q
1
cot ϕ , N
γ
2
N
q
1
tan ϕ
(2)
Eq. 3 is expressed according to empirical results for
ξ
at
.
Also, N
q
can be achieved from Eq. 4 which is shown as below:
ξ 3.05 ∗ 10
q
p
1.2
(3)
N
sin
ϕ
1
cos
ϕ
. exp6.1 ∗ 10
q
p
2.4 tan
ϕ
(4)
Jamiolkowski and Robertson, 1988 presented a correlation
for
′
as function of
and mean in situ stresses:
σ
′
σ
′
7.89 ∗ 10
q
σ
σ
′
.
(5)
Where
σ
and
σ
′
are the vertical total and effective
stresses, respectively.
The lateral stress increases by increasing the relative
density. Usually, in calculation, it is assumed that the lateral
stress value is equal to resistant horizontal stress by acceptable
accuracy as follows:
σ
′
1 sin
ϕ
1 sin
ϕ
σ
′
tan
π
4
ϕ
2
(6)
σ
′
k
.
σ
′
1 sin
ϕ
σ
′
,
σ
′
q
(7)
σ
σ
2
σ
3
σ
1 2k
3
(8)
σ
′
σ
′
2
σ
′
3
σ
′
1 2k
3
(9)
By substitution Eqs. 2 to 9 in two basic Eq.1 can be achieved
two sets of equation.10 as follow:
u
γ
B tan
ϕ
qN
γ
BN
tan
ϕ
C N
1 tan
ϕ
q
C 7.89 ∗ 10
1 sin
ϕ
σ
′
tan 2 3
ϕ
q
σ
2
σ
3
σ
′
2
σ
′
3
.
(10)
4 EXPERIMENTAL RECORDS FOR EVALUATION
Geotechnical properties and information including experimental
results from the data base of four sites have been compiled.
These records are containing 25 series of CPT and CPTu data
and shear strength parameters measured by laboratory tests
which are used for evaluating developed model. The site
specifications are briefly reviewed as follows:
Site No. 1
, Narenjestan tourism complex, (Mandro Co.,
2012); site is located in southern bank of Caspian Sea in
Mazandaran Province, Iran. According to borehole operations
results, observation and field tests from ground level silty sand
with medium dense deposits is located to the depth of 7.5 m.
Following the depth of 7.5 m the firm silt layer with high
plasticity exist with thickness of 2 m. From depth of 9.5 m
down to end of boring poorly graded, silty sand and sand are
located with of dense condition and classified as an SM, SP.
Site No. 2
, Narges Hotel complex, (Sham-e Co., 2012); is
located in southern Caspian Sea Shore in the suburb of Sari city
in Iran. The observation of three boreholes by rotary drilling
indicate that the superficial soil layer consists of alluvial gray
sea sand with some silt which exists to the depth of 11m.
According to USCS this layer is classified as SP, SM or SP-SM.
Between depth of 10m to 14m fine clay and silt layer are
located in dirty green color with the thickness of 1m to 4m
which is classified as CL. The bottom layer is containing fine
sea alluvial sand which is observed in depth of 11m to 30m and
is classified as SM. Also, the ground water level is located
below 3m of ground surface. For determining soil shear strength
parameters of filed soil stratification, direct shear, triaxial and
uniaxial tests are accomplished on samples. Also, according to
SPT records in subsurface depths around 10m, the N values are
ranged from 22 to 35, which represent medium to dense relative
density for upper layer. The N values in depth of 10m to 14m
and 14m to 30m vary from 12 to 25 and 22 to 45, respectively,
and classified as dense to high dense coarse grained deposit.
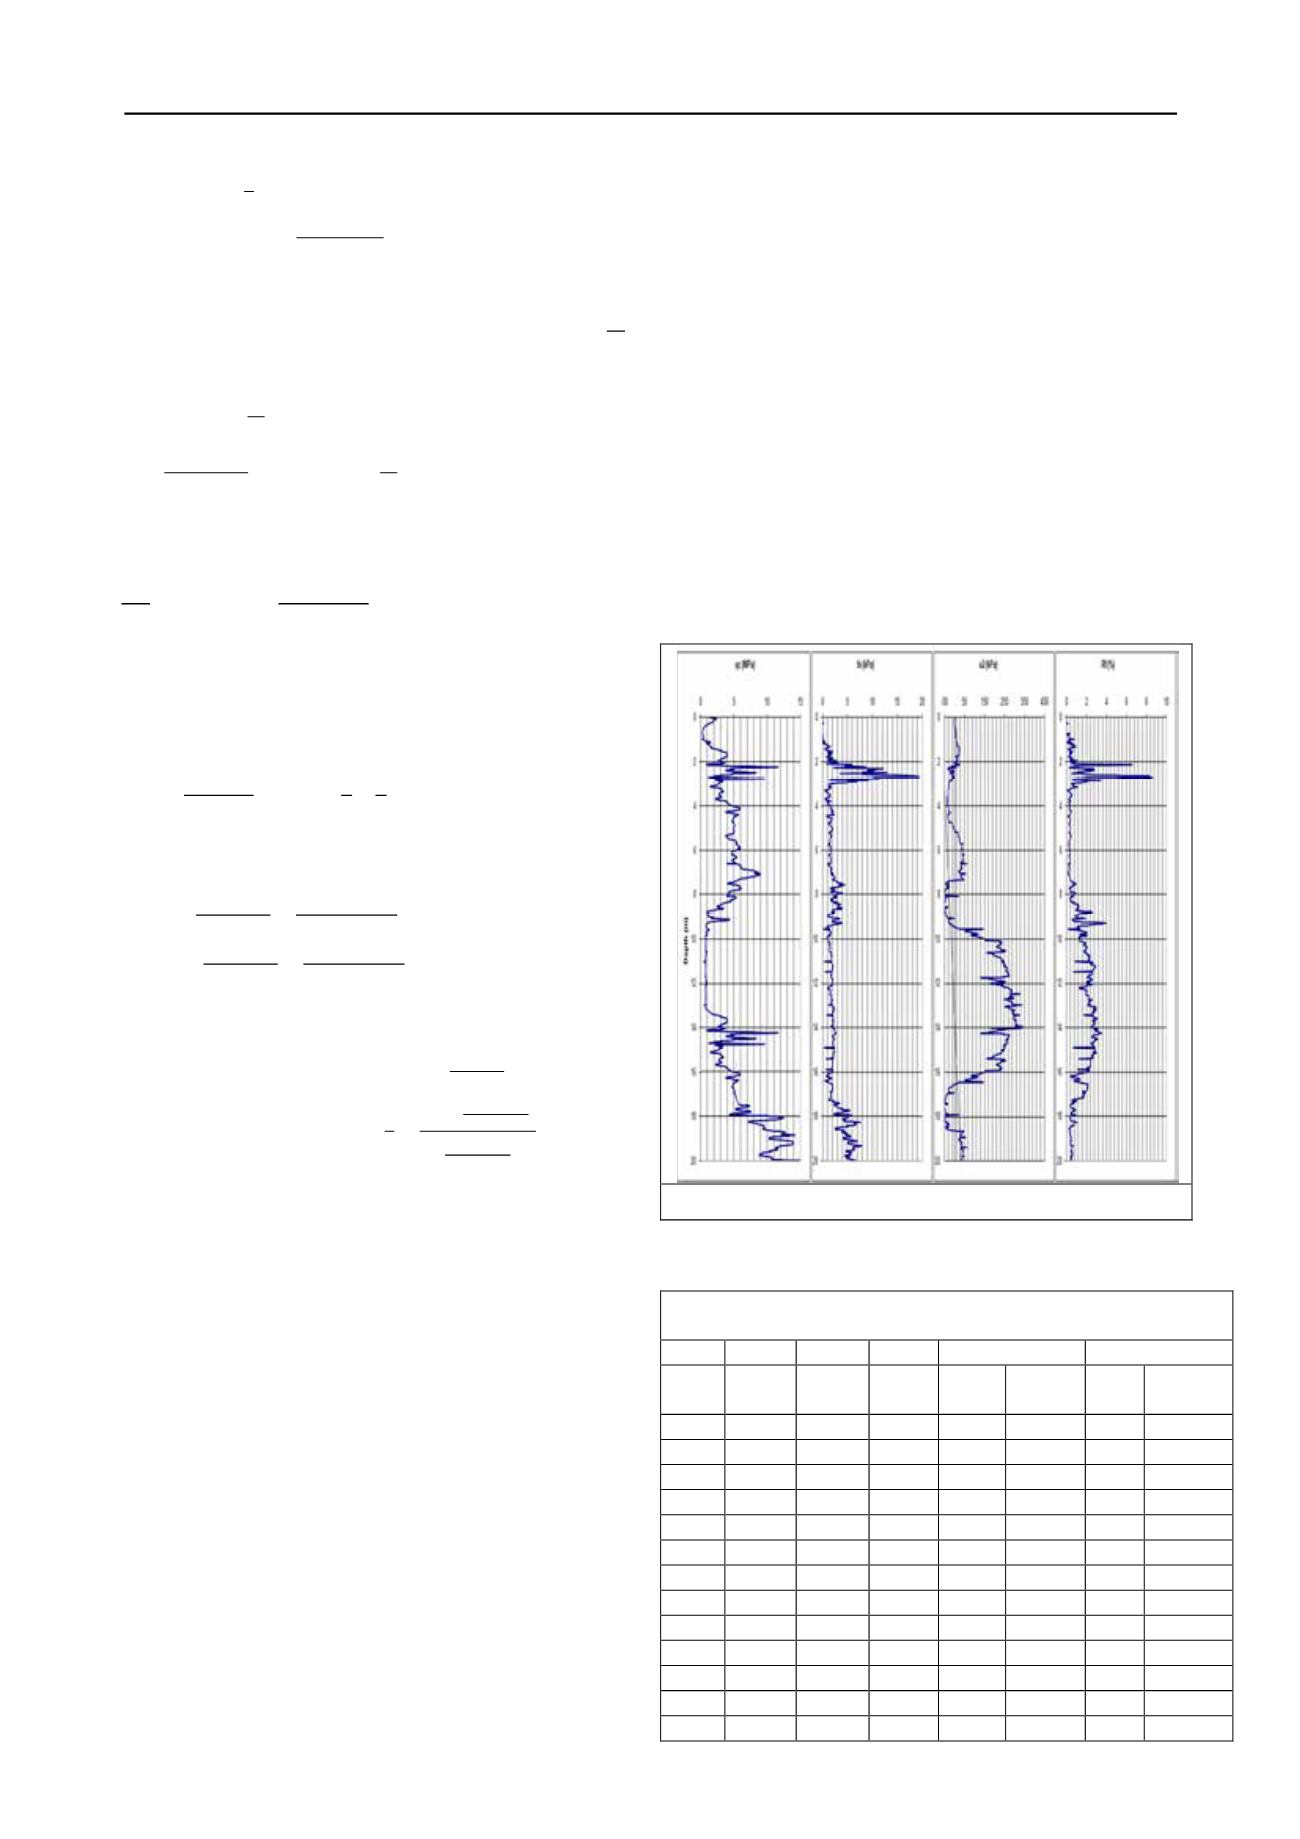
The CPTu profile in Sari Narges Hotel site is shown in Fig. 1.
Site No. 3
, East Changi, (Choa et al. 2004); site is a recovery
site which is located in eastern costal of Changi Airport in
Singapore. From geotechnical investigations, it is observed that
the geomaterial is a kind of soft to medium clay.
Site No. 4
, University of Texas which is known as A&M
Site, (Briaud and Gibbens, 1994). It is one of the international
site of study in geotechnical basis and is located in Texas
Province, USA. Soil deposits are formed of silty sand.
Figure 1. CPTu profiles in Narges Hotel Complex, (Sham-e Co., 2012)
The accumulated results of analytical procedure in 25 cases
and also laboratory test results are presented in Table 1.
Table 1. Shear strength parameters according to proposed method and
laboratory test results for 25 measure cases
C (kPa)
ϕ
Site
No.
Soil
type
q
E
(MPa)
f
s
(kPa)
Lab
test
proposed Lab
test
Proposed
І
SM
30
22
4
3.7
30
32
І
SP
13
65
4.5
5
30
31
І
SM
11
50
4
3.8
31
32
І
MH
13
40
50
49
4
6
І
SP
5
55
4
5
33
31
І
SM
22
110
4
3.5
33
31
І
SM
40
150
4
4.5
35
36
І
SM
28
140
4
5
35
37
І
SM
30
135
6
5.2
34
36
І
SM
18
60
6
8.4
38
37
ᴨ
SM
6
75
3
2.5
32
31
ᴨ
SM
5
30
0
1
32
32
ᴨ
SM
7
80
6
6.6
31
32


