602
Proceedings of the 18
th
International Conference on Soil Mechanics and Geotechnical Engineering, Paris 2013
where
f
and
s
are the shear strength and the shear force on the
slip surface exhibited in Figure 6, which shows a slip surface
across a finite element. In the figure,
l
i
is the length of the slip
surface of element
i
, and
n
is the number of elements, which a
slip circle crosses. The strength,
f
is defined by the Mohr-
Coulomb law of Equation (17). Normal stress
n
and shear
force
s
are defined in Figure 6, and calculated with the soil and
water coupling finite element method in this study. In the finite
element analysis, the pore pressure is estimated in the saturated
zone identified with the saturated - unsaturated seepage
analysis, and the negative pore water pressure in the unsaturated
zone is disregarded. This assumption can simplify the analysis
and make an evaluation for the stability that is on the safe side.
f
c
'
n
'tan
'
(17)
n
'
z
'
y
'
2
z
'
y
'
2
cos2
yz
sin2
(18)
s
z
'
y
'
2
sin2
yz
cos2
(19)
in which
c
' is the effective cohesion,
' is the effective internal
friction angle,
z
' and
y
' are the vertical and the horizontal
stresses,
yz
is the shear stress, and
is the angle between a
horizontal plane and a slip surface. The probability failure is
evaluated with Equation (20) through the use of the Monte
Carlo method.
P
f
Pr obability
g
0
(20)
For the internal friction angle
' of the embankment material Bs,
is dealt with as a random variable. Firstly, the random numbers
considering the spatial distribution derived from Equations (12)
and (13) are assigned to the
N
SWS
. Secondly, the random
variable
N
SPT
is evaluated by Equation (2) by considering the
conversion error
r
, and then the
' is obtained with Equation
(14), including the conversion error term 5.3
f
. The Monte
Carlo method is iterated 1000 times.
4.3
Risk evaluation
Two cases of the original embankment and the restored one are
compared, whose cross sections are shown in Figures 5(a) and
(b). In the figures, the representative slip surfaces, which give
the minimum safety factors, are exhibited. In Table 2, the
results of the reliability analysis are shown, in which
F
s
is the
average factor of safety,
P
f
is the probability of failure,
C
f
is the
failure cost, including the damage to houses, agricultural
facilities, and farm lands, and
C
F
is the value of the expected
failure cost. The average factor of safety is almost 1.0 for the
original embankment, and the probability of failure is nearly
20%, which seems very high. For the restored embankment, on
the other hand, the probability of failure is nearly zero and the
evaluated reduction in risk is drastic, at a value of 39,400,000
JPY. The reduction value means the effect of the improvement
work for the embankment.
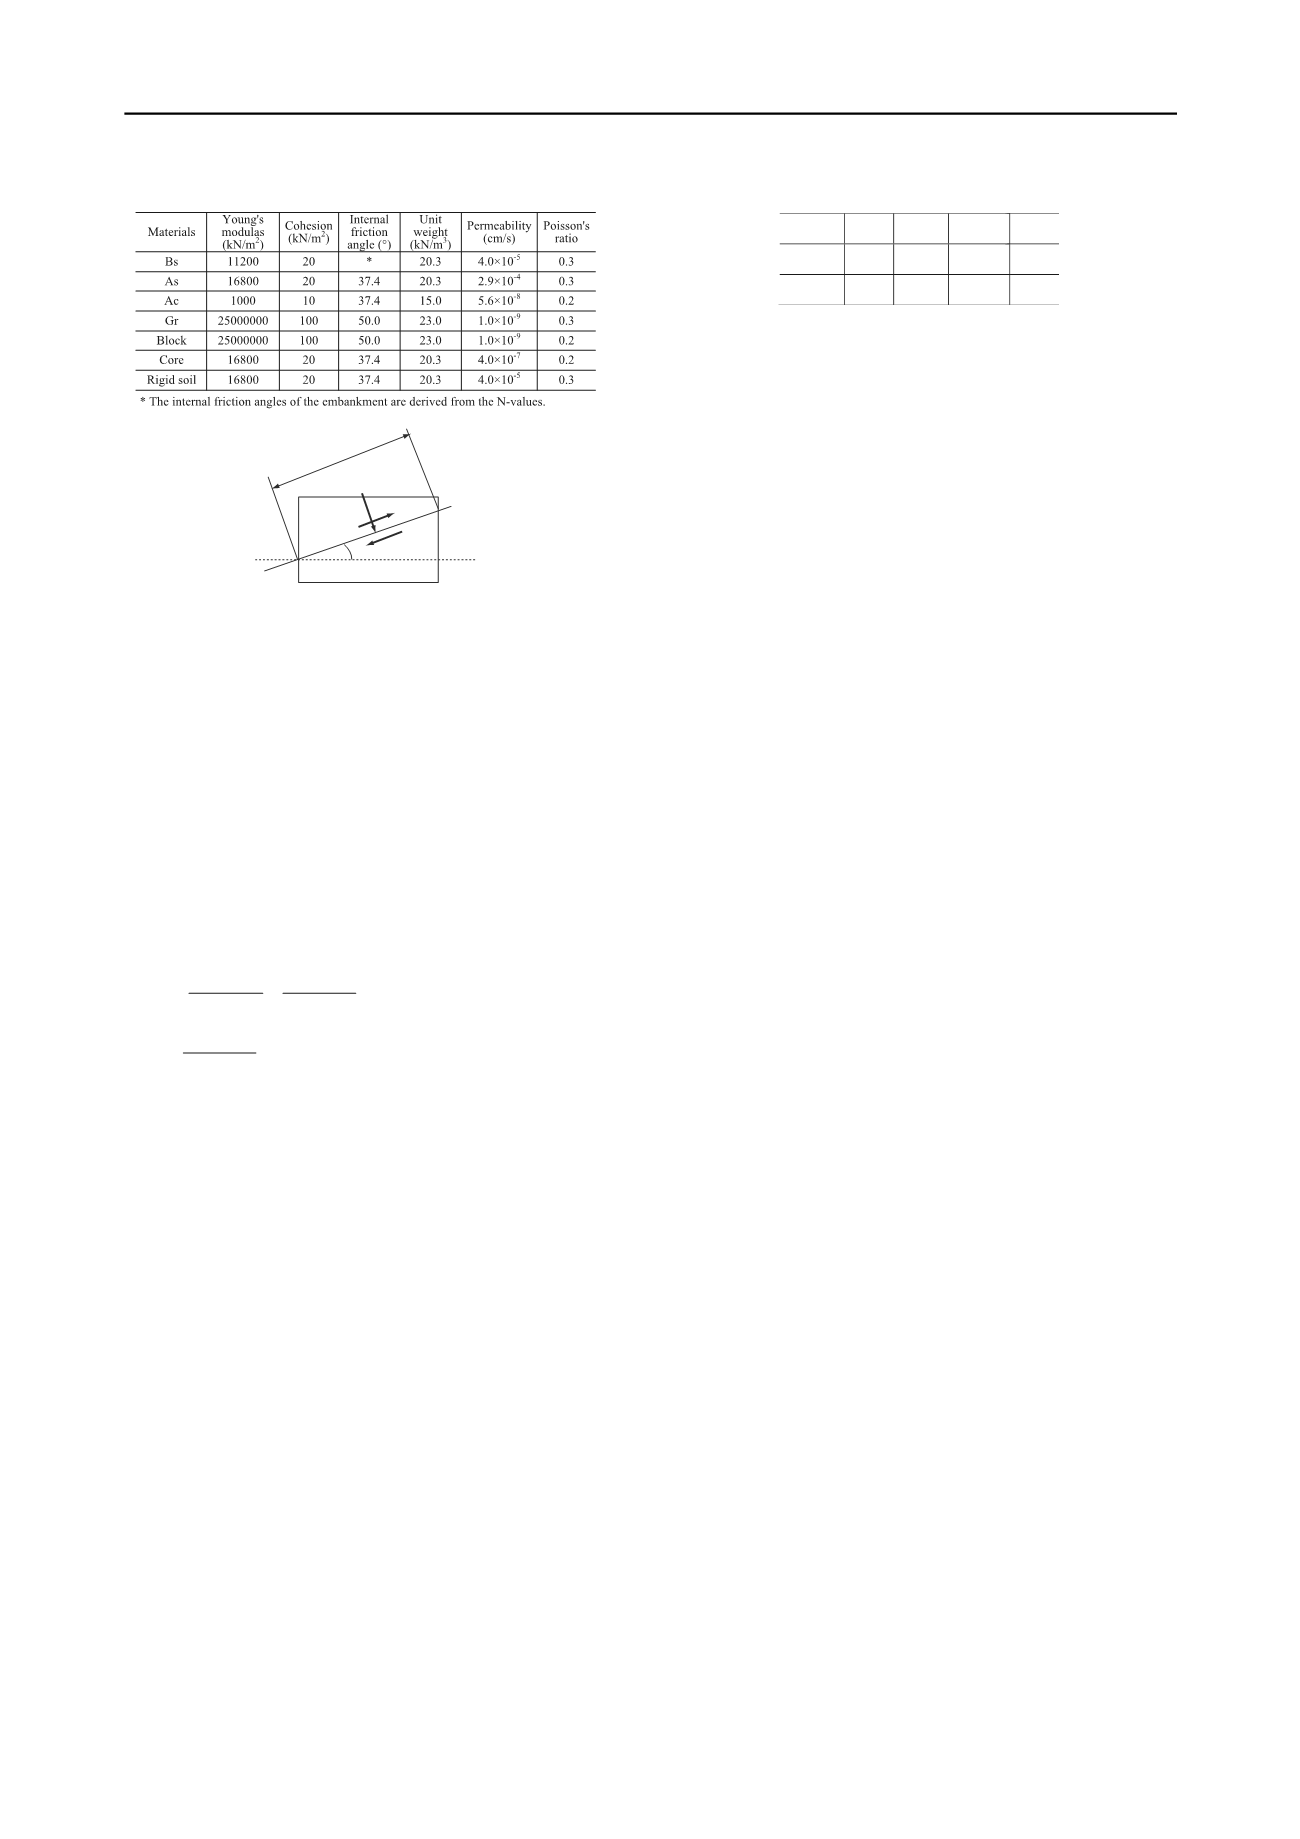
Table 1. Parameters of embankment materials.
θ
l
τ
f
τ
s
σ
n
′
Figure 6. Slip surface across an element
Table 2. Result of reliability analysis.
Fs
P
f
C
f
C
F
Original
1.04 0.197
3,940
Restored
1.62
0
0
Unit (10000 JPY)
2,000
2,000
C
F
=
C
f
⋅
P
f
5 CONCLUSIONS
(1) A method to determine the statistical models of the soil
strength was presented. The indicator simulation, which is one
of the geostatistical methods, was employed. With the proposed
procedure, a detailed spatial distribution of the
N
-values was
exhibited.
(2) Based on the determined statistical model of the internal
friction angle, including the spatial distribution of the
N
-values,
the two conversion errors, from the SWS
N
-value to the SPT
N
-
value, and the SPT
N
-value to the internal friction angle, the
reliability analysis was conducted for an earth-fill embankment,
and the probability of failure was evaluated for the original state
of the embankment and the restored state of the embankment.
By comparing the risks between the original state and the
restored one, the effect of the improvement work of the
embankment was evaluated
6 ACKNOWLEDGEMENTS
This work was partly supported by JSPS KAKENHI
(23248040).
7 REFERENCES
Akaike H. 1974. A new look at the statistical model identification.
IEEE
Trans. on Automatic Control
, AC-19 (6), 716-723.
Cafaro F. and Cherubini C. 2002. Large sample spacing in evaluation of
vertical strength variability of clayey soil.
Journal of Geotechnical
and Geoenvironmental Engineering
128 (7), 558-568.
Deutsch C.V. and Journel A.G. 1992.
Geostatistical Software Library
and User’s Guide
, Oxford University Press.
Inada M. 1960. Usage of Swedish weight sounding results.
Tsuchi-to-
Kiso
, J. of JSSMGE 8 (1), 13-18 (in Japanese).
Journel A.G. and Huijbregts Ch.J. 1978.
Mining geostatistics
, Academic
Press.
Hatanaka M. and Uchida A. 1996. Empirical correlation between
penetration resistance and internal friction angle of sandy soils.
Soils and Foundations
36(4), 1-9.
Nishigaki M. 2001.
AC-UNSAF3D User's Manual
. (in Japanese).
Shinoda M., Horii K., Yonezawa T., Tateyama M. and Koseki J. 2006.
Reliability-based seismic deformation analysis of reinforced soil
slopes.
Soils and Foundations
46 (4), 477-490.
Soulie P., Montes P. and Silvestri V. 1990. Modelling spatial variability
of soil parameters.
Canadian Geotechnical Journal
27. 617-630.
Tang W.H. 1979. Probabilistic evaluation penetration resistances.
Journal of the geotechnical engineering
, ASCE, 105(GT10). 1173-
1191.
Uzielli M., Vannucchi and Phoon, K. K. 2005. Random field
characterization of stress-normalized cone penetration testing
parameters.
Geotechnique
55(1), 3-20.
Yoshida, I., Arakawa, T., Kitazume, T. and OOtsu H. 2005. Study on
seismic probabilistic safety assessment of a slope,
Journal of
geotechnical engineering
, JSCE, No.785, 27-37.


